Spiral chart: Difference between revisions
minor clarifications |
mNo edit summary |
||
| Line 1: | Line 1: | ||
A '''spiral chart''' is an illustration which converts a circle of repeats of an interval in one [[edo]] into a self-similar spiral shape, so that it may be compared with a circle of the same interval in a smaller coprime edo. | A '''spiral chart''' is an illustration which converts a circle of repeats of an interval in one [[edo]] into a self-similar spiral shape, so that it may be compared with a circle of the same interval in a smaller coprime edo. | ||
Spiral charts were invented by [[Kite Giedraitis]] in | Spiral charts were invented by [[Kite Giedraitis]] in April 2014. | ||
== Spirals of twelve fifths == | == Spirals of twelve fifths == | ||
Revision as of 11:59, 20 December 2024
A spiral chart is an illustration which converts a circle of repeats of an interval in one edo into a self-similar spiral shape, so that it may be compared with a circle of the same interval in a smaller coprime edo.
Spiral charts were invented by Kite Giedraitis in April 2014.
Spirals of twelve fifths
The spiral charts for 31edo, 41edo and 53edo relate each of those edos to 12edo. Each chart has 12 wheel-spokes.
The larger edo's spiral of fifths is not really a spiral, it's a larger circle of fifths that is broken into a chain to make several smaller 12-note loops. Then a few duplicates are added at each end of the chain, so that one can reconnect the ends mentally to get the original larger circle.
A 12-spoke spiral chart of fifths is only possible if the dodeca-sharpness (edosteps per Pythagorean comma) of the larger edo is 1 or -1. A 12-spoke spiral of semitones is possible for edos of the form 12n+1 or 12n-1, but those spirals are less interesting because they convey very little info that isn't already in the table of edosteps.
Gallery
-
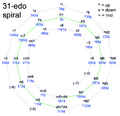 31edo spiral chart
 -
 41edo spiral chart
 -
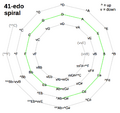 41edo spiral chart (notation)
 -
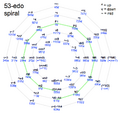 53edo spiral chart


Spirals of other amounts, other intervals
Such a spiral chart can be made for any two edos, as long as they are coprime. It's often a spiral of something other than fifths. In fact, it's a spiral of the nearest miss.
For example, consider 8edo and 27edo. The near misses are 3\8 and 10\27. You get an 8-spoke spiral of 27edo major 3rds. This might be useful for someone researching octatonic scales in 27edo.
Relationship to the scale tree

|
Todo: complete section |