Expanding tonal space
This is the opening page (Part I) of a small series of articles discussing the model of tonal space.
The following article describes how to visually arrange a set of overtone scales in order to expand a particular plane of tonal space.
Why expand tonal space in this way?
The concept is a step towards building an electronic keyboard instrument that allows the player to interactively map sequences of rational intervals to consecutive keys – in real time, even live on stage. Therefore, the player needs convenient and intuitive access to the mapping process, which becomes an integral part of the musical performance.
With a prototypical instrument in place, the search for intermediary chords in tonal music begins. We can identify (and play) supplementary consonant chords that fit seamlessly into the gaps of familiar chord progressions. Listen to the following two audio examples to get the idea...
Listen to Control Info ...a sequence of five
beatless minor chords[math]\displaystyle{ I }[/math]min, [math]\displaystyle{ I }[/math]min, [math]\displaystyle{ IV }[/math]min,
[math]\displaystyle{ IV }[/math]min, [math]\displaystyle{ I }[/math]min...an inserted
intermediary chord
on the 2nd beat[math]\displaystyle{ I }[/math]min, [math]\displaystyle{ I }[/math]xen-augmin, [math]\displaystyle{ IV }[/math]min,
[math]\displaystyle{ IV }[/math]min, [math]\displaystyle{ I }[/math]min ... (2 times)
The proposed model of tonal space utilizes the uniform structure and simple mathematical description of overtone scales as well as the closely related arithmetic frequency division of the octave (AFDO).
For each note to be rendered, the model should effectively determine the current deviation from 12-tone equal temperament (12edo) in order to control the intonation of a commercial sound module or software plug-in on the fly.
How to expand tonal space – the interval axis
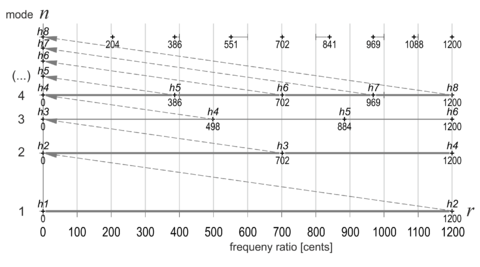
Like frequency, musical pitch is one-dimensional. Fig.1 illustrates the horizontal axis of tonal space, which we call the interval axis. It points in keyboard direction from low keys to high keys. The first harmonic (h1) is known as the common fundamental of all upcoming overtone scales.

The mode axis
The vertical axis of our model of tonal space indicates modes of the harmonic series. All modes start at the same normalized frequency (or pitch) of 0 cents. This means that the tonics of all of these overtone scales share exactly the same pitch (Fig. 2), which can be chosen arbitrarily.
Since each mode (row) begins with a member of the harmonic series, we can space adjacent modes by corresponding rational intervals for plotting on the logarithmic vertical axis.

The Horizon Chart
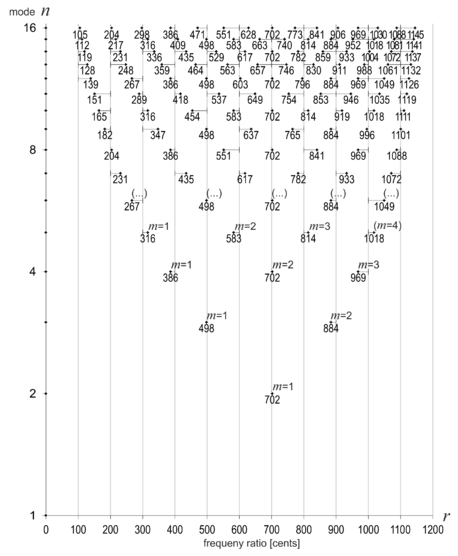
The result of visualizing more modes of the overtone scale (up to Mode 16) is shown in Fig. 3:

Each pitch is labeled with the size of an interval in cents, measured from the tonic (0 ¢) to the corresponding pitch marker (+). Each pitch marker is connected to the nearest vertical 12edo-line by a delta indicator. We define the direction and length of this indicator as the signed intonation interval of the respective pitch.
The AFDO-page can help to reproduce this plot:
- "Within each period of any n-afdo system, the frequency ratio r of the m-th degree is"...
- [math]\displaystyle{ \displaystyle r=\frac{n+m}{n} }[/math] , where
- r is a rational frequency ratio which – after conversion to cents –
is displayed against the horizontal interval axis of tonal space - n is the mode of an overtone scale, plotted on the vertical axis
- m addresses (indexes, counts) the elements of each overtone scale in horizontal direction from the tonic (left, starting at 0) to the right.
- r is a rational frequency ratio which – after conversion to cents –
In particular ...
- if m = 0, then r = 1 (0 ¢) and
- if m = n, then r = 2 (1200 ¢)
Example 1: A just major third relates the first element (m=1) of a Mode 4 (n=4) overtone scale to the tonic of Mode 4 (with m=0) and we get
- [math]\displaystyle{ r=\frac{4+1}{4}=\frac{5}{4} }[/math]
- [math]\displaystyle{ r_{cents}= ln(r)\cdot\frac{1200}{ln(2)} \approx 386 }[/math] ¢
Intonation
Intonation is an adjustment of pitch applied to notes - live at performance time.
In the context of this model, we use 12edo pitches as the reference scale for measuring intonation. To describe intonation precisely (but without reference to concert pitch or absolute frequency), we define
- Intonation is the signed interval between...
- a pitch, generated by a pressed key with a given key descriptor (such as A3, B3, C4, C#4, ...),
that rings exactly in tune with 12-tone equal temperament (12edo) and - a deviating pitch referenced by the same key descriptor
- a pitch, generated by a pressed key with a given key descriptor (such as A3, B3, C4, C#4, ...),
Typically, intonation is a small interval between -50 ¢ and +50 ¢ alhough larger values are allowed. In our model, the common tonic of all modes of the overtone scale has an intonation of 0 ¢ by definition.
According to this definition, the upper pitch of the just major third above the tonic (Mode 4, see Example 1) has an intonation interval of -14 ¢, which represents the distance from the nearest vertical 12edo line. Note that we generally measure intonation beginning at the nearest 12edo pitch. This results in a minus sign for the intonation of the upper note of the just third.
- [Note: The unusual definition of the sign is based on a technical perspective and caused by the plan to build a real instrument. The signed intonation interval represents the amount of retuning required when a commercially available sound module is factory tuned to 12-tone equal temperament.]
Calculate intonation
To calculate the signed intonation interval...
- compute the remainder of the original interval’s value in cents by a modulo division e.g. [math]\displaystyle{ (386 }[/math] ¢ [math]\displaystyle{ mod(100)) }[/math], the intermediate result is 86 ¢
- Test: If the intermediate result is greater than 50 ¢ then subtract 100 ¢
- The test is true and the final result is 86 ¢ -100 ¢ = -14 ¢
Determine the nearest 12edo interval
In order to determine the closest 12edo interval (r12edo ) to which intonation is to be applied, get the original interval rcents and do some integer arithmetic:
- [math]\displaystyle{
r_{12edo}=integer\left (\frac{r_{cents}+50c}{100.0} \right )\cdot 100 }[/math]
- [math]\displaystyle{
r_{12edo}=integer\left (\frac{r_{cents}+50c}{100.0} \right )\cdot 100 }[/math]
... according to Example 1:
- [math]\displaystyle{ r_{12edo}=integer\left (\frac{386c+50c}{100.0} \right )\cdot 100=400 }[/math] ¢
Number of distinct intervals
The first five octaves of Tonal Space contain a fairly large number of intervals footed on a common tonic of 0 ¢. The intervals are well structured in rows, with each row corresponding to a mode of the overtone scale. It may be of interest to the reader to know how many different intervals are present, since some obviously occur more than once.
To find out, we will scan the Horizon Chart line by line (mode by mode), from the bottom up. Mode 1 has no intervals between the fundamental and the next octave. In Mode 2 we find a pure fifth, the third harmonic. This is the first time the pure fifth appears, and - like any other interval - it is only considered once as we scan.
Table 1 summarizes the scanning results from Mode 1 through Mode 16.
- Table 1: Count of distinct intervals depending on the highest implemented mode
Mode 1
up to
Mode 16
ModeNumber of
new intervals
found at
this modeAggregated
number
of different
rational intervalsTotal number
of intervals
scannedMode
found in
octave
number16 8 79 120 5 15 8 71 105 4 14 6 63 91 4 13 12 57 78 4 12 4 45 66 4 11 10 41 55 4 10 4 31 45 4 9 6 27 36 4 8 4 21 28 4 7 6 17 21 3 6 2 11 15 3 5 4 (...) 9 10 3 4 2 (3rd, b7th) 5 6 3 3 2 (4th, 6th) 3 3 2 2 1 (5th) 1 1 2 1 0 0 0 1
A variety of projections of the model
Keep in mind that the Horizon Chart (Fig.3) is just a graphical representation of relationships between pitches, musical intervals and overtone scales. More specifically, Fig.3 shows one of many useful Cartesian projections of an abstract model onto a 2D-plane.
Nevertheless, this representation is the basis for a variety of realtime operations on chords that a future musical instrument can apply. In addition, the Cartesian projection of tonal space (with a straight horizontal line for each mode of an overtone scale) can be easily handled in a programming environment. (See Part III for more on Cartesian and polar projections of tonal space.)
Polar projection of tonal space
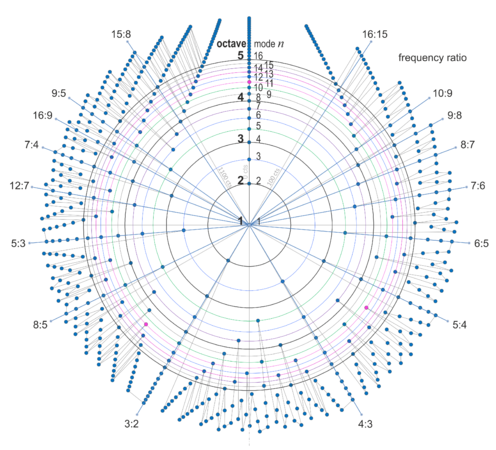
In polar projection the horizontal mode lines form circles:

The center is the location of the fundamental, where Mode n=1 and m=0. This corresponds to the origin of the Cartesian coordinate system as in Fig.3. The mode axis runs from the center up to the north. A clockwise angle of 2π (in radians) represents one octave up. Each dot represents a pitch.
The labeled spokes reveal a hidden symmetry of tonal space that is not apparent in Cartesian projection.
Note that a line drawn from the center to the south (at an angle of π) represents an irrational interval with a frequency ratio of √2 ≈ 1.414..., a tritone of 600 ¢. Unsurprisingly, no rational interval fits exactly on this line.
General applicability
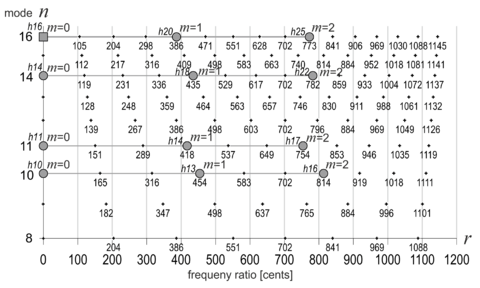
In the model discussed so far a chord is composed of at least two stacked intervals with frequency ratios taken from the harmonic series in ascending order. The chord should be footed on the tonic of the particular mode. Skipped harmonics within a chord may remain mute. Fig.5 shows a comparison of four augmented chords that sound quite different:

The model of tonal space is well suited for the design and comparison of chords. No matter what intervals we mark on any horizontal line, the result will always be a chord made up of just intervals that share a common denominator. Therefore, any such chord is a local subset of the harmonic series at its proper position.
A final example: If we want to create a major b7 chord, we will find four suitable pitches in the horizontal Mode 4-line (Fig.3) from m=0 to m=3. To replace the upper 7/4 interval with, say, a 9/5 interval, we determine the Least Common Denominator (LCM, which is 4*5=20 in this case) to get a 20:25:30:36 chord, which lives in Mode 20 (not shown) and sounds noticeably more dissonant.
Find out more about tonal space…
Part II: Planar extensions
Part III: Projections
Part IV: Third dimension
See also…
Sethares, William A. Tuning Timbre Spectrum Scale. London: Springer Verlag , 1999. [p65, 3.7. Overtone Scales]