File:WilsonHeightIntegerLimit.png
Original file (2,320 × 1,020 pixels, file size: 94 KB, MIME type: image/png)
Summary
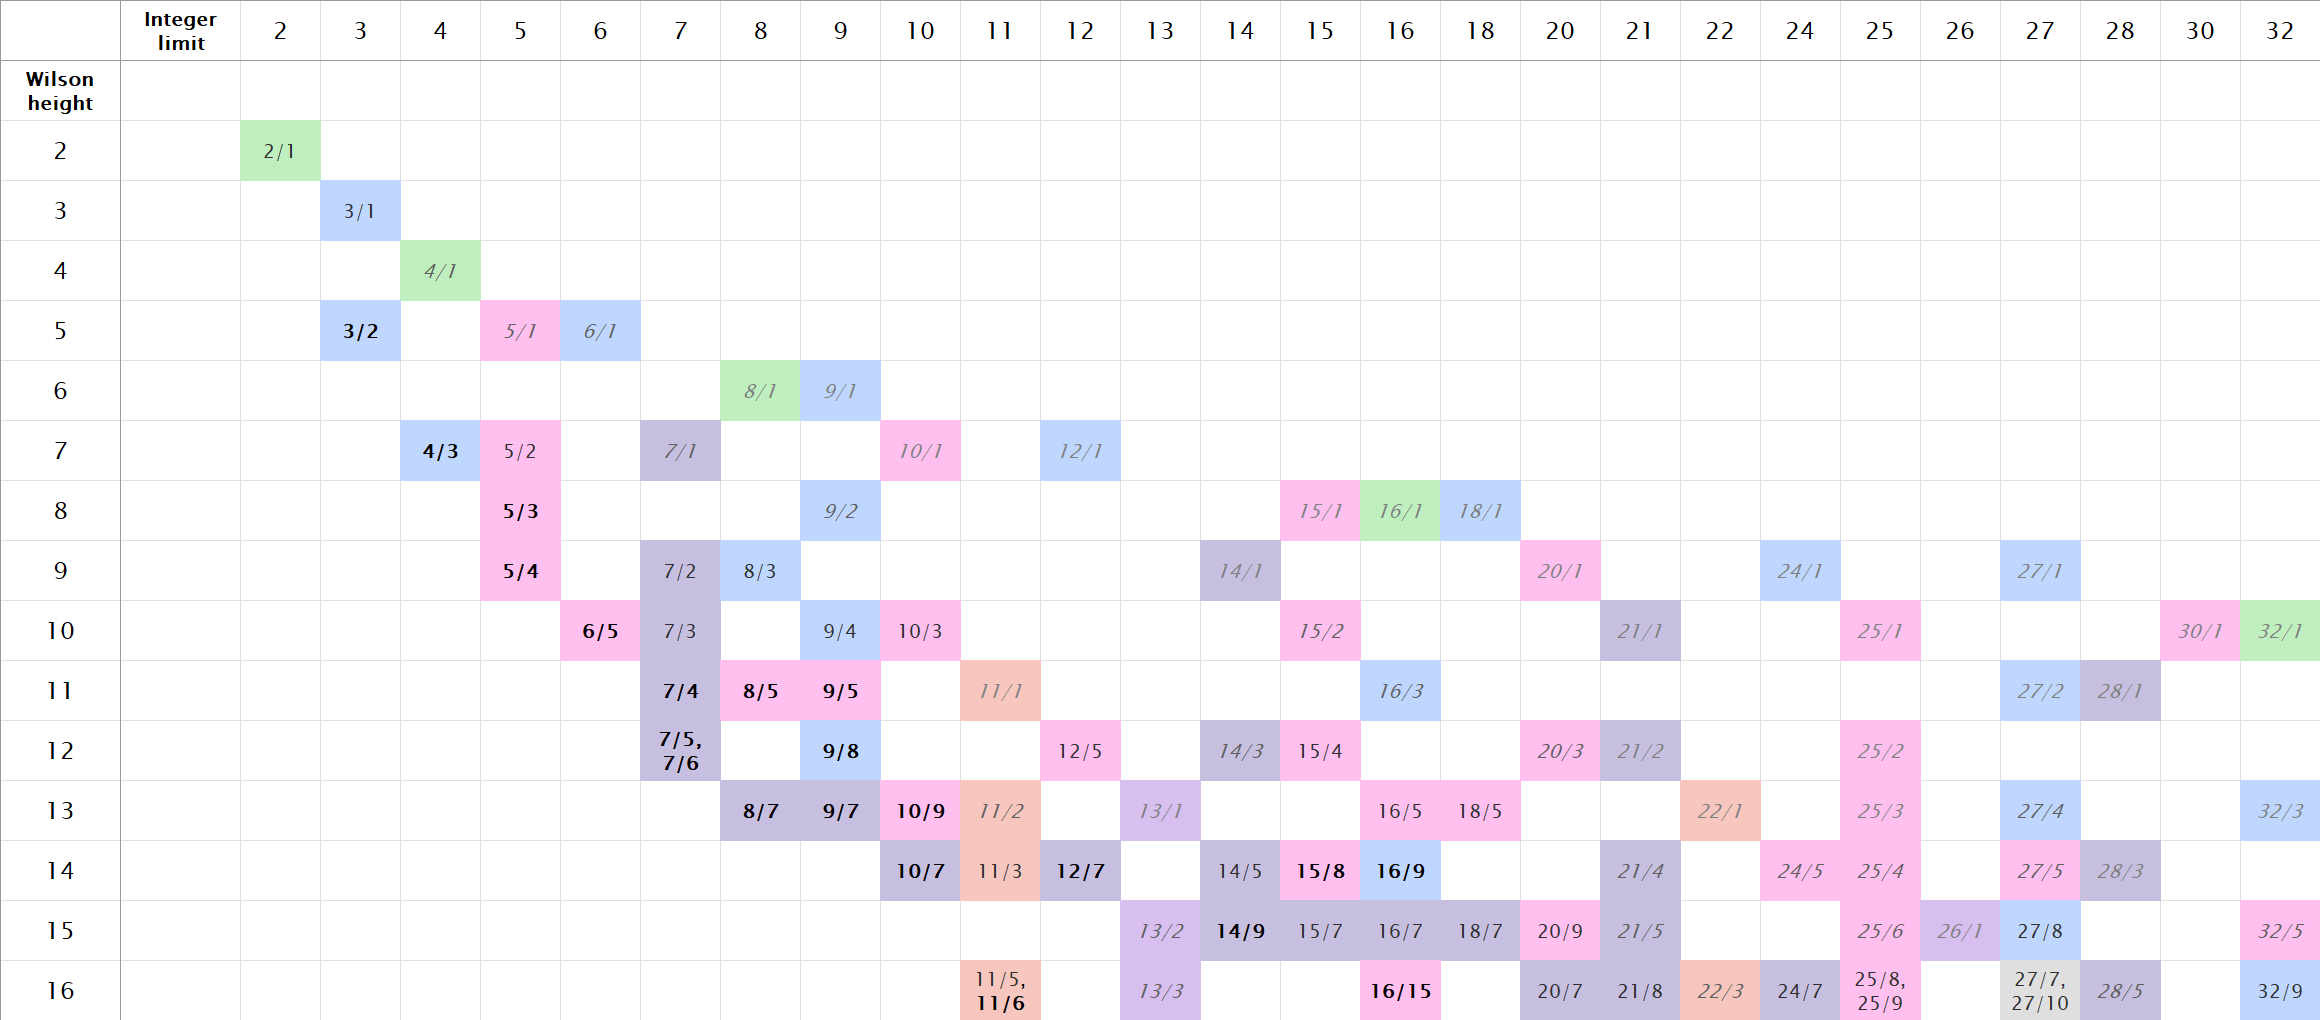
Diagram by Lériendil showing the Wilson height (vertical axis) versus integer limit (horizontal axis) of simple intervals. Cells are colored based on the prime limit of their interval - green for 2-limit, azure for 3-limit, pink for 5-limit, navy for 7-limit, red for 11-limit, and purple for 13-limit; note that one cell is gray because it contains a 5-limit interval (27/10) and 7-limit interval (27/7) simultaneously. Text is formatted based on the octave the interval falls in: bold for intervals between 1/1 and 2/1, normal text between 2/1 and 4/1, dark gray italic between 4/1 and 8/1, and light gray italic above 8/1.
Licensing
File history
Click on a date/time to view the file as it appeared at that time.
| Date/Time | Thumbnail | Dimensions | User | Comment | |
|---|---|---|---|---|---|
| current | 02:39, 26 May 2025 | | 2,320 × 1,020 (94 KB) | BudjarnLambeth (talk | contribs) | Diagram by Lériendil showing the Wilson height (vertical axis) versus integer limit (horizontal axis) of simple intervals. |
You cannot overwrite this file.
File usage
The following 2 pages use this file: