Harmonic entropy
Harmonic entropy (HE) is a simple model to quantify the extent to which musical chords align with the harmonic series, and thus tend to partly "fuse" into the perception of a single sound with a complex timbre and virtual fundamental pitch.
A simple way to state this, is: harmonic entropy measures degree of certainty in the perception of the (virtual) root.
Harmonic entropy was invented by Paul Erlich and developed extensively on the Yahoo! tuning and harmonic_entropy lists, and draws from prior research by Parncutt and Terhardt. Various later contributions to the model have been made by Steve Martin, Mike Battaglia, Keenan Pepper, and others.
An interactive harmonic entropy graph can be found in Scale Workshop version 3 in the Analysis tab.
Note: the terms dyad, triad and tetrad usually refer to chord with 2, 3, or 4 pitch classes. But in this discussion they refer to chords with 2, 3, or 4 pitches. Thus C – E – G – C is a tetrad instead of a triad.
Background
The general workings of the human auditory system lead to a plethora of well-documented and sonically interesting phenomena that can occur when a musical chord is played:
- The perception of partial timbral fusion of the chord into one complex sound
- The appearance of a virtual fundamental pitch in the bass
- Critical band effects, such as timbral beatlessness, compared to mistunings of the chord in the surrounding area
- The appearance of a quick fluttering effect sometimes known as periodicity buzz
There has been much research specifically on the musical implications critical band effects in the literature (e.g. Sethares's work), which are perhaps the psychoacoustic phenomena that readers are most familiar with. However, the modern xenharmonic community has displayed immense interest in exploring the other effects mentioned above as well, which have proven extremely important to the development of modern xenharmonic music.
These effects sometimes behave differently, and do not always appear strictly in tandem with one another. For instance, Paul Erlich has noted that most models for beatlessness measure 10:12:15 and 4:5:6 as being identical, whereas the latter exhibits more timbral fusion and a more salient virtual fundamental than the former. However, it is useful to have a term that refers to the general presence of these types of effects. The term "consonance" has sometimes been used for this; however, there are many other meanings of consonance which may not be psychoacoustic in nature. Thus, we instead speak of a general notion of psychoacoustic concordance – the degree to which effects such as the above will appear when an arbitrary musical interval or chord is played – as well and psychoacoustic discordance. Timbral fusion, the appearance of virtual fundamentals, beatlessness, and periodicity buzz, can all be thought of as different aspects of psychoacoustic concordance.
Harmonic entropy was originally intended to measure, in particular, the "virtual fundamental" aspect of psychoacoustic concordance, being modeled on J. Goldstein's 1973 paper "An optimum processor theory for the central formation of the pitch of complex tones." It can also be thought of as an elaboration on similar research by Terhardt, Parncutt and others, which addresses some of the shortcomings suggested by Erlich in prior models. The model basically asks how "confused your brain is," in Erlich's words, when trying to match the incoming sound to that of one single harmonic timbre played on a missing fundamental.
For dyads, the basic harmonic entropy model is fairly simple: it places the dyad we are trying to measure amidst a backdrop of JI candidates. Then, it uses a point-spread function to determine the relative strengths of the match to each, which are then normalized and treated as probabilities. The "entropy" of the resulting probability distribution is a way to measure how closely this distribution tends to focus on one possibility, rather than being spread out among a set of equally-likely possibilities. If there is only one clear choice of dyad which far exceeds all others in probability, the entropy will be lower. If, on the other hand, there are many equally-likely probabilities, the entropy will be higher. The basic harmonic entropy model can also be extended to modeling triads, tetrads, and so on; the standard way to do so is to simply look at the incoming triad's match to a set of candidate JI triads, and likewise with tetrads, and etc.
Additional interpretations
In recent years, it has become clearer that the model can also be very useful in modeling other types of concordance as well, particularly for dyads, where the same model does a very good job in also predicting beatlessness, periodicity buzz, and so on. In particular, Erlich has often suggested the same model, perhaps with slightly different parameters, can also be useful to measure how easy it is to tune a dyad by ear on an instrument such as a guitar, or how much of a sense of being "locked-in" the dyad gives as it is tuned more closely to JI. This may be less related to the perception of virtual fundamentals than it is to beatlessness and so on.
However, it should be noted that the various aspects of psychoacoustic concordance tend to diverge quite strongly in their behavior for larger chords, and thus, when modeling different aspects of psychoacoustic concordance, different ways of generalizing the dyadic model to higher-cardinality chords may be appropriate. In particular, when modeling beatlessness, Erlich has suggested instead looking only at the entropies of the pairwise dyadic subsets of the chord, so that the major and minor chords would be ranked equal in beatlessness, whereas they would not be ranked equal in their ability to produce a clear virtual fundamental (the major chord would be much stronger and lower in entropy).
Concordance vs. actual consonance
Concordance has often been confused with actual musical consonance, an unfortunate fact made more common by the psychoacoustics literature under the unfortunate name sensory consonance, most often used to refer to phenomena related to roughness and beatlessness specifically. This is not to be confused with the more familiar construct of tonal stability, typically just called "consonance" in Western common practice music theory and sometimes clarified as "musical consonance" in the music cognition literature. To make matters worse, the literature has also at times referred to concordance—and not tonal stability—as tonal consonance, often referring to phenomena related to virtual pitch integration, creating a complete terminological mess. As a result, the term "consonance" has been completely avoided in this article.
While psychoacoustic concordance is not a feature universal to all styles of music, it has been utilized significantly in Western music in the study of intonation. For instance, flexible-pitch ensembles operating within 12-EDO, such as barbershop quartets and string ensembles, will often adjust intonationally from the underlying 12-EDO reference to maximize the concordance of individual chords. Indeed, the entire history of Western tuning theory—from meantone temperament, to the various Baroque well-temperaments, to 12-EDO itself, to the modern theory of regular temperament—can be seen as an attempt to reason mathematically about how to generate manageable tuning systems that will maximize concordance and minimize discordance. Consonance and dissonance, on the other hand, is a much more general phenomenon which can even exist in music which is predominantly monophonic and uses no chords at all.
Basic model: Shannon entropy
The original harmonic entropy model limited itself to working with dyads. More recently, work by Steve Martin and others has extended this basic idea to higher-cardinality chords. This article will concern itself with dyads, as the dyadic case is still the most well-developed, and many of the ideas extend naturally to larger chords without need for much exposition.
The general idea of Harmonic Entropy is to first develop a discrete probability distribution quantifying how strongly an arbitrary incoming dyad "matches" every element in a set of basis rational intervals, and then seeing how evenly distributed the resulting probabilities are. If the distribution for some dyad is spread out very evenly, such that there is no clear "victor" basis interval that dominates the distribution, the dyad is considered to be more discordant; on the other extreme, if the distribution tends to concentrate on one or a small set of dyads, the dyad is considered to be more concordant.
A clear mathematical way of quantifying this "dispersion" is via the Shannon entropy of the probability distribution, which can be thought of as describing the "uncertainty" in the distribution. A distribution which has a very high probability of picking one outcome has low entropy and is not very uncertain, whereas a distribution which has the probability spread out on many outcomes is highly uncertain and has a high entropy.
Definitions
To formalize our notion of Shannon entropy, we will first describe the random variable J, representing the set of JI "basis" intervals that our incoming interval is being "matched" to, and the parameter C, representing the "cents" of the incoming interval being played. For example, the interval C would take values such as "400cents", and the interval J would take values in the set of basis ratios, such as "5/4" or "9/7."
So for example, if we want to express the probability that the incoming dyad "400 ¢ is perceived as the JI basis interval "5/4," we would write that as the conditional probability $$\displaystyle \newcommand{\cent}{\text{¢}}$$ $$\displaystyle P(J=5/4\,|\, C=400\cent)$$
Or, in general, if we want to write the conditional probability that some incoming dyad of c cents is perceived as the JI basis interval j, we would write that as
$$\displaystyle P(J=j\,|\, C=c)$$
which notationally, we will often abbreviate as
$$\displaystyle P(j|c)$$
Note that at this point, we haven't yet specified what the particular probability distribution is. There are different ways to do this, which are described in more detail below. Generally, most approaches involve each JI interval's probability being assigned based on how close it is to c (closer dyads are given a larger probability), and how simple it is (simple dyads are given a higher probability, if distance is the same).
A noteworthy point is that we generally do not assume any probability distribution on C. This reflects that we do not make any assumptions at all about which notes or intervals are likely to be played to begin with. In other words, we are treating C more as a "parameter" rather than as a random variable.
Once we have decided on a probability distribution, we can finally evaluate the Shannon entropy. For a random variable X, the Shannon entropy is defined as:
$$\displaystyle H(X) = -\sum_{x \in X} P(x) \log_b P(x)$$
where the different x are taken from the sample space of X, and b is the base of the log. Different choices of b simply change the units in which entropy is given, the most common values being 2 and e, denoting "bits" and "nats". We will omit the base going forward, for simplicity.
In our case, we want to find the entropy of the random variable J of JI intervals, given a particular choice of incoming dyad in cents. The corresponding quantity that we want is:
$$\displaystyle H(J|c) = -\sum_{j \in J} P(j|c) \log P(j|c)$$
Note that above, the summation is only taken on the j from the sample space of J (i.e. the set of JI basis intervals), whereas the parameter c is treated as constant within the summation (and is taken as the free parameter to the function).
Since the parameter c is the free parameter, sometimes the above is notated as
$$\displaystyle \text{HE}(c) = H(J|c)$$
which makes more explicit that c is the argument to the harmonic entropy function, which is equal to the entropy of J, conditioned on the incoming dyad of c cents.
Probability distributions
In order to systematically assign a probability distribution to this dyad, we first start by defining a spreading function, denoted by S(x), that dictates how the dyad is "smeared" out in log-frequency space, representing how the auditory system allows for some tolerance for mistuning. The typical choice that we will assume here for a spreading function is a Gaussian distribution, with mean centered around the incoming dyad, and standard deviation typically taken as a free parameter in the system and denoted as s.
A fairly typical choice of settings for a basic dyadic HE model would be:
- The basis set is all those rationals bounded by some maximum Tenney height, with the bound typically notated as N and set to at least 10,000.
- The spreading function is typically a Gaussian distribution with a frequency deviation of 1% either way, or about s ≈ 17 ¢.
Other spreading functions have also been explored, such as the use of the heavy-tailed Laplace distribution, sometimes described as the "Vos function" in Paul's writings. These two functions are part of the Generalized normal distribution family, which has a parameter not only for the variance but for the kurtosis. However, for simplicity, we will assume the Gaussian distribution as the spreading function for the remainder of this article, so that the spreading function for an incoming dyad c can be written as follows:
$$\displaystyle S(x-c) = \frac{1}{s\sqrt{2\pi}} e^{-\frac{(x-c)^2}{2s^2}}$$
where the notation S(x − c) is chosen to make clear that we are translating S(x) to be centered around the incoming dyad c, which is now the mean of the Gaussian.
We assume here that the variable x is a dummy variable representing cents, and will adopt this convention for the remainder of the article.
In this notation, s becomes the standard deviation of the Gaussian, being an ASCII-friendly version of the more familiar symbol σ for representing the standard deviation. Note that in previous expositions on Harmonic Entropy, s was sometimes given in units representing a percentage of linear-frequency deviation; we allow s to stand for cents here to simplify the notation. To convert from a percentage to cents, the formula ¢ = 1200(1 + log2(percentage)) can be used.
It is also common to use as a basis set all those rationals bounded by some maximum Weil height, with a typical cutoff for N set to at least 100. This has sometimes been referred to as seeding HE with the "Farey sequence of order N" and its reciprocals, so references in Paul's work to "Farey series HE" vs "Tenney series HE" are sometimes seen.
Lastly, the set of rationals is often chosen to be only those "reduced" rationals within the cutoff, such that n/d is in the set only if n and d are coprime. HE can also be formulated with unreduced rationals as well. Both methods tend to give similar results. In Paul's work, reduced rationals are most common, although the use of unreduced rationals may be useful in extending HE to the case where N = ∞.
Given a spreading function and set of basis rationals, there are two different procedures commonly used to assign probabilities to each rational. The first, the domain-integral approach, works for arbitrary nowhere dense sets of rationals without any further free parameters. The second, the simple weighted approach, has nice mathematical properties which sometimes make it easier to compute and which may lead to generalizations to infinite sets of rationals which are sometimes dense in the reals. It is conjectured that there are certain important limiting situations where the two converge; both are described in detail below.
Domain-integral probabilities
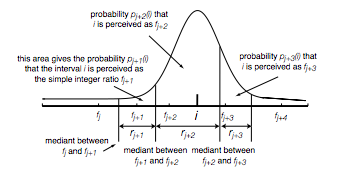
For discrete sets of JI basis ratios, the log-frequency spectrum can be divided up into domains assigned to each ratio. Each ratio is assigned a domain with lower bound equal to the mediant of itself and its nearest lower neighbor, and likewise with upper bound equal to the mediant of itself and its nearest upper neighbor. If no such neighbor exists, [math]\displaystyle{ \pm \infty }[/math] is used instead. Mathematically, this can be represented via the following expression:
$$\displaystyle P(j|c) = \int_{\cent\left(j_l\right)}^{\cent\left(j_u\right)} S(x-c) dx$$
where S(x − c) is the spreading function associated with c, jl and ju are the domain lower and upper bounds associated with JI basis ratio j, and [math]\displaystyle{ \cent(f) = 1200\log_2(f) }[/math], or the "cents" function converting frequency ratios to cents. Typically, jl is set equal to the mediant of j and its nearest lower neighbor (if it exists), or −∞ if not; likewise with ju and its nearest upper neighbor.
This process can be summarized by the following picture, taken from William Sethares' paper on Harmonic Entropy:
Note the difference in terminology here—in this example, the fj + n are the basis ratios, the rj + n are the domains for each basis ratio, and the bounds for each domain are the mediants between each fj + n and its nearest neighbor. The probability assigned to each basis ratio is then the area under the spreading function curve for each ratio's domain. The entropy of this probability distribution is then the Harmonic Entropy for that dyad.
In the case where the set of basis rationals consists of a finite set bounded by Tenney or Weil height, the resulting set of widths is conjectured to have interesting mathematical properties, leading to mathematically nice conceptual simplifications of the model. These simplifications are explained below.
Simple Weighted Probabilities
It has been noted empirically by Paul Erlich that, given all those rationals with Tenney height under some cutoff N as a basis set, that the domain widths for rationals sufficiently far from the cutoff seem to be proportional to [math]\displaystyle{ \frac{1}{\sqrt{nd}} }[/math].
While it's still an open conjecture that this pattern holds for arbitrarily large N, the assumption is sometimes made that this is the case, and hence that for these basis ratio sets, [math]\displaystyle{ \frac{1}{\sqrt{nd}} }[/math] "approximations" to the width are sufficient to estimate domain-integral Harmonic Entropy.
This modifies the expression for the probabilities P(j|c) as follows, noting that for now the "probabilities" won't sum to 1:
$$\displaystyle Q(j|c) = \frac{S(\cent(j)-c)}{\sqrt{j_n \cdot j_d}}$$
where the Q notation now represents that these "probabilities" are unnormalized, and jn and jd are the numerator and denominator, respectively, of JI basis ratio j. Again, the set of basis rationals here is assumed to be all of those rationals of Tenney height ≤ N for some N.
A similar observation for the use of Weil-bounded subsets of the rationals suggests domain widths of 1/max(n, d), yielding instead the following formula:
$$\displaystyle Q(j|c) = \frac{S(\cent(j)-c)}{\max(j_n, j_d)}$$
where this time the set of basis rationals is assumed to be all of those of Weil height ≤ N for some N.
In both cases, the general approach is the same: the value of the spreading function, taken at the value of ¢(j), is divided by some sort of "weighting" (or sometimes, "complexity") function representing how much weight is given to that rational number. While the two weighting functions considered thus far were derived empirically by observing the asymptotic behavior of various height-bounded subsets of the rationals, we can generalize this for arbitrary basis sets of rationals and arbitrary weights as follows:
$$\displaystyle Q(j|c) = \frac{S(\cent(j)-c)}{\|j\|}$$
where |j| denotes a weighting function that maps from rational numbers to non-negative reals.
As these "probabilities" don't sum to 1, the result is not a probability distribution at all, invalidating the use of the Shannon Entropy. To rectify this, the distribution is normalized so that the probabilities do sum to 1:
$$\displaystyle P(j|c) = \frac{Q(j|c)}{\sum_{j \in J} Q(j|c)}$$
which is equal to the unnormalized probability, divided by the sum of all unnormalized probabilities. This definition of P(j|c) is then used directly to compute the entropy.
This approach to assigning probabilities to basis rationals is useful because it hypothetically makes it possible to consider the HE of sets of rationals which are dense in the reals, or even the entire set of positive rationals, although the best way to do this is a subject of ongoing research.
Examples
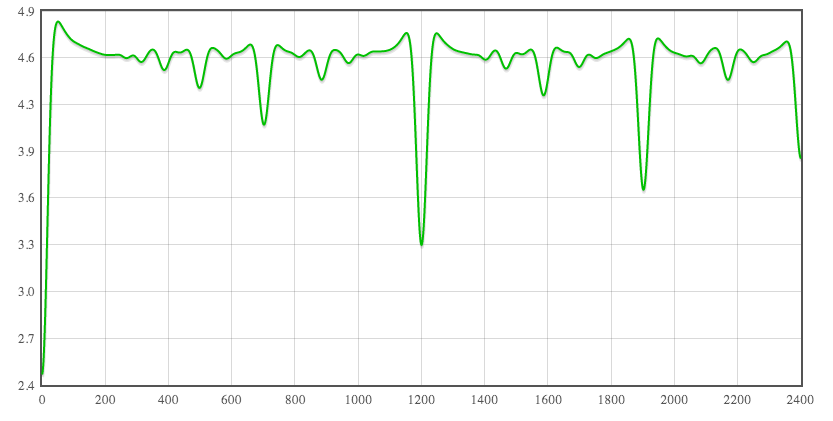
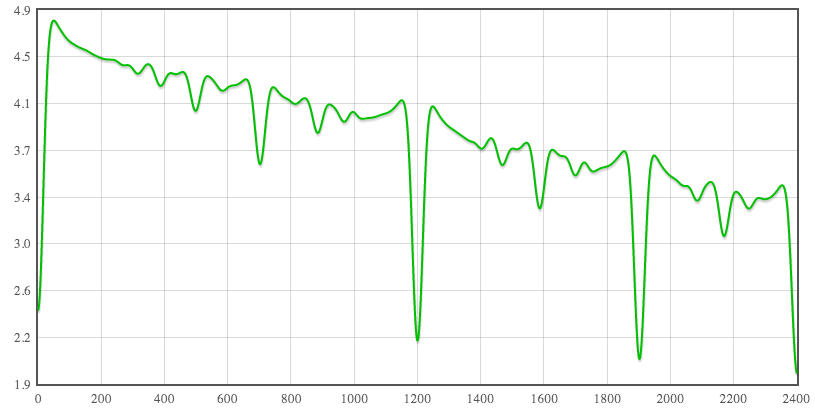
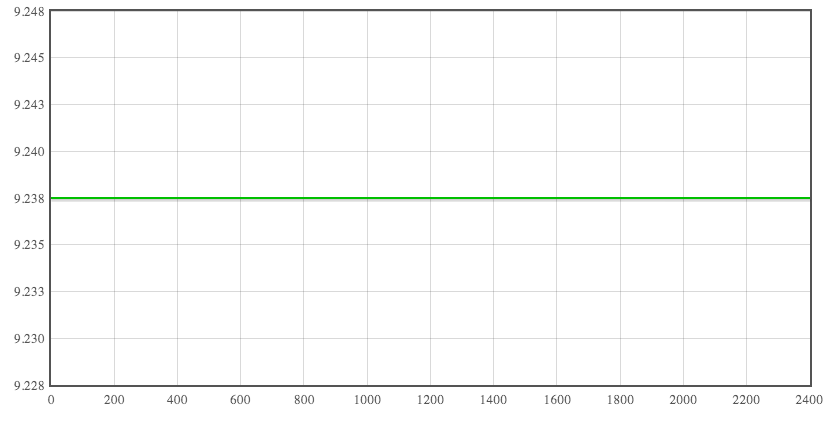
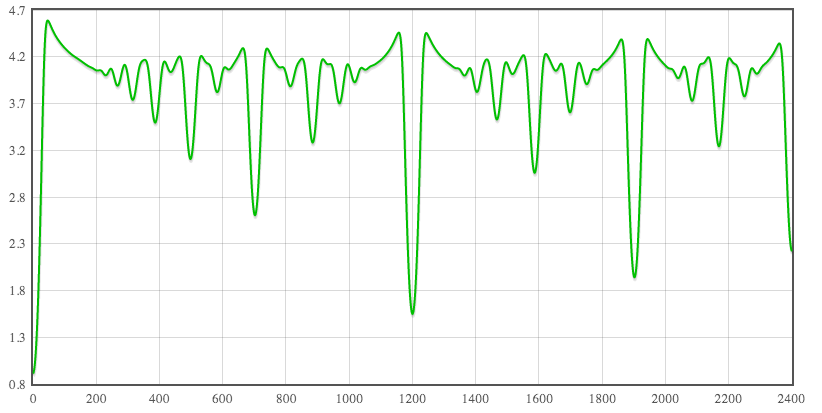
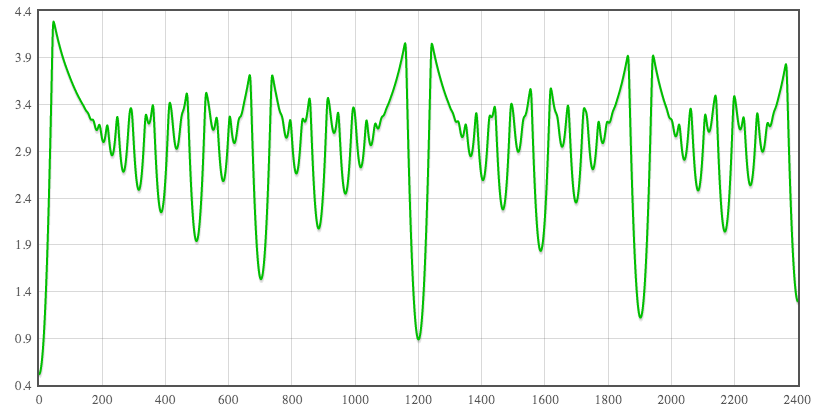
In all of these examples, the x-axis represents the width in cents of the dyad, and the y-axis represents discordance rather than concordance, measured in nats of Shannon entropy.
s = 17, N < 10000, [math]\displaystyle{ \sqrt{nd} }[/math] weights
This uses as a spreading function the Gaussian distribution with s = ~17 ¢ (or a lin-frequency deviation of 1%). The basis set is all rationals of Tenney height less than 10,000. This uses the simple weighted approach, and the weighting function is [math]\displaystyle{ \sqrt{nd} }[/math]:
s = 17, N < 100, max(n, d) weights
This example uses the same spreading function and standard deviation, but this time the basis set is all rationals of Weil height less than 100. The weighting function here is max(n, d):
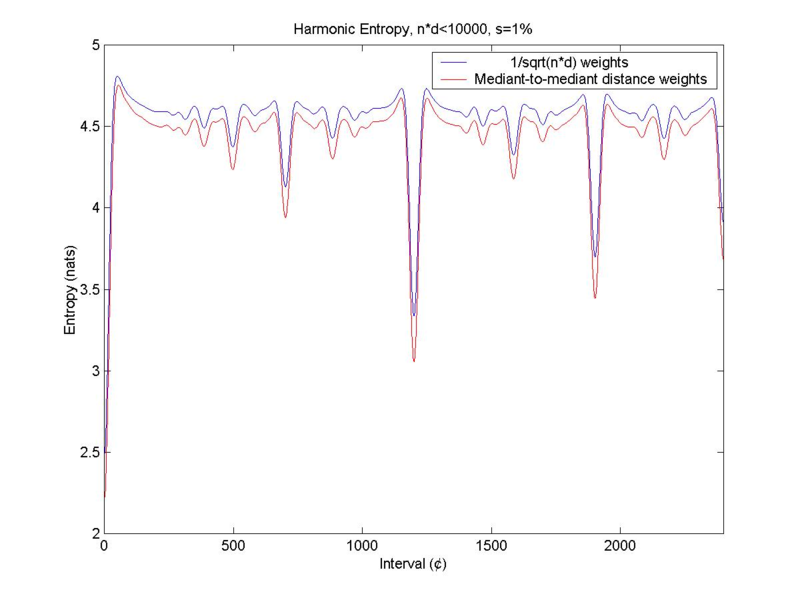
s = 17, N < 10000, [math]\displaystyle{ \sqrt{nd} }[/math] vs. mediant-to-mediant weights
The following image (from Paul Erlich) compares the domain-integral and simple weighted approaches by overlaying the two curves on top of each other. In both cases, the spreading function is again a Gaussian with s = ~17 ¢, and the basis set is all those rationals with Tenney height ≤ 10000. It can be seen that the curves are extremely similar, and that the locations of the minima and maxima are largely preserved:
Harmonic Rényi entropy
An extension to the base Harmonic Entropy model, proposed by Mike Battaglia, is to generalize the use of Shannon entropy by replacing it instead with Rényi entropy, a q-analog of Shannon's original entropy. This can be thought of as adding a second parameter, called a, to the model, reflecting how "intelligent" the brain's "decoding" process is when determining the most likely JI interpretation of an ambiguous interval.
Definitions and background
The Harmonic Rényi entropy of order a of an incoming dyad can be defined as follows:
$$\displaystyle \text{HE}_a(c) = H_a(J|c) = \frac{1}{1-a} \log \sum_{j \in J} P(j|c)^a$$
Being a q-analog, it is noteworthy that Rényi entropy converges to Shannon entropy in the limit as a → 1, a fact which can be verified using L'Hôpital's rule as found here.
The Rényi entropy has found use in cryptography as a measure of the strength of a cryptographic code in the face of an intelligent attacker, an application for which Shannon entropy has long been known to be insufficient as described in this paper and this RFC. More precisely, the Rényi entropy of order ∞, also called the min-entropy, is used to measure the strength of the randomness used to define a cryptographic secret against a "worst-case" attacker who has complete knowledge of the probability distribution from which cryptographic secrets are drawn.
In a musical context, by considering the incoming dyad as analogous to a cryptographic code which is attempting to be "cracked" by an intelligent auditory system, we can consider that the analogous "worst-case attacker" would be a "best-case auditory system" which has complete awareness of the probability distribution for any incoming dyad. This analogy would view such an auditory system as actively attempting to choose the most probable rational, rather than drawing a rational at random weighted by the distribution.
The use of a = ∞ min-entropy would reflect this view. In contrast, the use of a = 1 Shannon entropy reflects a much "dumber" process which performs no such analysis and perhaps doesn't even seek to "choose" any sort of "victor" rational at all. As the parameter a interpolates between these two options, it can be interpreted as the extent to which the rational-matching process for incoming dyads is considered to be "intelligent" and "active" in this way.
Some psychoacoustic effects naturally fit into this paradigm, such as the virtual pitch integration process, which actually does attempt to find a single victor when matching incoming chords with chunks of the harmonic series. Other psychoacoustic effects, such as that of beatlessness, may instead be better viewed as "dumb" processes whereby nothing in particular is being "chosen," but where a more uniform distribution of matching rational numbers for a dyad simply generates a more discordant sonic effect. Different values of a can differentiate between the predominance given to these two types of effect in the overall construct of psychoacoustic concordance.
Certain values of a reduce to simpler expressions and have special names, as given in the examples below.
Examples
a = 0: Harmonic Hartley entropy
$$\displaystyle H_0(J|c) = \log |J|$$
where |J| is the cardinality of the set of basis rationals. This assumes, in essence, an "infinitely dumb" auditory system which can do no better than picking a rational number from a uniform distribution completely at random. All dyads have the same Harmonic Hartley Entropy. The Hartley Entropy is sometimes called the "max-entropy," and is useful mainly as an upper bound on the other forms of entropy: all Rényi Entropies are always guaranteed to be less than the Hartley Entropy.
Harmonic Hartley Entropy (a = 0) with the basis set all rationals with Tenney height ≤ 10000. Note that the choice of spreading function makes no difference in the end result at all.
a = 1: Harmonic Shannon entropy
$$\displaystyle H_1(J|c) = -\sum_{j \in J} P(j|c) \log P(j|c)$$
This is Paul's original harmonic entropy. Within the cryptographic analogy, this can be thought of as an auditory system which simply selects a rational at random from the incoming distribution, weighted via the distribution itself.
Harmonic Shannon Entropy (a = 1) with the basis set all rationals with Tenney height ≤ 10000, spreading function a Gaussian distribution with s = 1% (~17 ¢), and [math]\displaystyle{ \sqrt{nd} }[/math] weighting.
a = 2: Harmonic collision entropy
$$\displaystyle H_2(J|c) = -\log \sum_{j \in J} P(j|c)^2 = -\log \left(J_1 = J_2\,\vert\,c\right)$$
where J1 and J2 are two independent and identically distributed random variables of JI basis ratios, conditioned on the same incoming dyad c, and the collision entropy is the same as the negative log of the probability that the two JI variables produce the same outcome.
Harmonic Collision Entropy (a = 2) with the basis set all rationals with Tenney height ≤ 10000, spreading function a Gaussian distribution with s = 1% (~17 ¢), and [math]\displaystyle{ \sqrt{nd} }[/math] weighting.
a = ∞: Harmonic min-entropy
$$\displaystyle H_\infty(J|c) = -\log \max_{j \in J} P(j|c)$$
This min-entropy simply takes the negative log of the largest probability in the distribution. This can be thought of as representing the "strength" of the incoming dyad from being "deciphered" by a "best-case" auditory system. The name "min-entropy" reflects that the a = ∞ case is guaranteed to be a lower bound among all Rényi entropies.
Harmonic Rényi Entropy with a = 7, with the high value of a being chosen to approximate min-entropy (a = ∞). The basis set is still all rationals with Tenney height ≤ 10000, the spreading function a Gaussian distribution with s = 1% (~17 ¢), and the weighting function [math]\displaystyle{ \sqrt{nd} }[/math].
Convolution-based expression for quickly computing Rényi entropy
Below is given an derivation that expresses harmonic Rényi entropy in terms of two simpler functions, each of which is a convolution product and hence can be computed quickly using the fast Fourier transform (FFT).
The below derivation depends on the use of simple weighted probabilities, although it may be possible to extend to domain-integral probabilities instead.
Preliminaries
Harmonic Rényi entropy is defined as
$$\displaystyle \text{HE}_a(c) = H_a(J|c) = \frac{1}{1-a} \log \sum_{j \in J} P(j|c)^a$$
As before, we can write [math]\displaystyle{ P(j|c) }[/math] as follows:
$$\displaystyle P(j|c) = \frac{Q(j|c)}{\sum_{j \in J} Q(j|c)}$$
where [math]\displaystyle{ Q(j|c) }[/math] is the "unnormalized" probability, and the denominator above is the sum of these unnormalized probabilities, so that all of the [math]\displaystyle{ P(j|c) }[/math] sum to 1.
To simplify notation, we first rewrite the denominator as a "normalization" function:
$$\displaystyle \psi(c) = \sum_{j \in J} Q(j|c)$$
and putting back into the original equation, we get
$$\displaystyle H_a(J|c) = \frac{1}{1-a} \log \left( \sum_{j \in J} \left( \frac{Q(j|c)}{\psi(c)} \right)^a \right)$$
Since ψ(c) is the same for each basis ratio, we can pull it out of the summation to obtain:
$$\displaystyle H_a(J|c) = \frac{1}{1-a} \log \left( \frac{\sum_{j \in J} Q(j|c)^a}{\psi(c)^a} \right)$$
To simplify notation further, we can also rewrite the numerator, the sum of "raw" (unnormalized) pseudo-probabilities, as a function:
$$\displaystyle \rho_a(c) = \sum_{j \in J} Q(j|c)^a$$
Finally, we put this all together to obtain a simplified version of the Harmonic Rényi Entropy equation:
$$\displaystyle \text{HE}_a(c) = H_a(J|c) = \frac{1}{1-a} \log \left( \frac{\rho_a(c)}{\psi(c)^a} \right)$$
We thus reduce the term inside the logarithm to the quotient of the functions ρa(c) and ψ(c). Our aim is now to express each of these two functions in terms of a convolution product.
Convolution product for ψ(c)
ψ(c), the normalization function, is written as follows:
$$\displaystyle \psi(c) = \sum_{j \in J} Q(j|c)$$
Again, Q(j|c) is defined as follows:
$$\displaystyle Q(j|c) = \frac{S(\cent(j)-c)}{\|j\|}$$
We can rewrite the above equation as a convolution with a delta distribution:
$$\displaystyle Q(j|c) = \left(S \ast \frac{\delta_{-\cent(j)}}{\|j\|}\right)(-c)$$
Putting this back into the original summation, we obtain
$$\displaystyle \psi(c) = \sum_{j \in J} \left(S \ast \frac{\delta_{-\cent(j)}}{\|j\|}\right)(-c)$$
We note that the left factor in the convolution product is always the same S(−c), which is not dependent on j in any way. Since convolution distributes over addition, we can factor the S out of the summation to obtain
$$\displaystyle \psi(c) = \left[S \ast \left(\sum_{j \in J} \frac{\delta_{-\cent(j)}}{\|j\|}\right)\right](-c)$$
We can clean up this notation by defining the auxiliary distribution K:
$$\displaystyle K(c) = \sum_{j \in J} \frac{\delta_{-\cent(j)}}{\|j\|}$$
Which leaves us with the final expression:
$$\displaystyle \psi(c) = \left[S \ast K\right](-c)$$
Convolution product for ρa(c)
The derivation for ρa(c) proceeds similarly. Recall the function is written as follows:
$$\displaystyle \rho_a(c) = \sum_{j \in J} Q(j|c)^a$$
The expression for each Q(j|c)a is:
$$\displaystyle Q(j|c)^a = \frac{S(\cent(j)-c)^a}{\|j\|^a}$$
We can again express this as a convolution, this time of the function Sa(−c), meaning the spreading function S taken to the ath power, and a delta distribution:
$$\displaystyle Q(j|c)^a = \left(S^a \ast \frac{\delta_{-\cent(j)}}{\|j\|^a}\right)(-c)$$
Putting this back into the original summation and factoring as before, we obtain
$$\displaystyle \rho_a(c) = \left[S^a \ast \left(\sum_{j \in J} \frac{\delta_{-\cent(j)}}{\|j\|^a}\right)\right](-c)$$
And again we clean up notation by defining the auxiliary distribution
$$\displaystyle K^a(c) = \sum_{j \in J} \frac{\delta_{-\cent(j)}}{\|j\|^a}$$
so that
$$\displaystyle \rho_a(c) = \left[S^a \ast K^a\right](-c)$$
We have now succeeded in representing ρa(c) as a convolution.
Note that the function Ka(c) involves a slight abuse of notation, as it is not literally K(c) taken to the ath power (as the square of the delta distribution is undefined). Rather, we are simply taking the weights of each delta distribution in the summation to the ath power.
Round-up
Taking all of this, we can rewrite the original expression for Harmonic Rényi Entropy as follows:
$$\displaystyle \text{HE}_a(c) = H_a(J|c) = \frac{1}{1-a} \log \left( \frac{\left[S^a \ast K^a\right](-c)}{\left[S \ast K\right]^a(-c)} \right)$$
where the expression
$$\displaystyle \left[S \ast K\right]^a(-c)$$
represents the convolution of S and K, taken to the ath power, and flipped backwards. Note that if S(x) is a symmetrical (even) spreading function, and if for each ratio n/d in J, if the inverse d/n is also in J, then the above convolution will also be symmetrical, and we also have
$$\displaystyle \left[S \ast K\right]^a(-c) = \left[S \ast K\right]^a(c)$$
We have succeeded in representing harmonic Rényi entropy in simple terms of two convolution products, each of which can be computed in O(N log N) time.
Extending HE to N = ∞: zeta-HE
All of the models described above involve a finite set of rational numbers, bounded by some weighting function, and where the weighting is less than some max value N.
It so happens that we are more or less able to analytically continue this definition to the situation where N = ∞. More precisely, we are able to analytically continue the exponential of HE, which yields the same relative interval rankings as standard HE.
The only technical caveat is that we use the HE of the "unnormalized" probability distribution. However, in the large limit of N, this appears to agree closely with the usual HE. We go into more detail below about this.
Our basic approach is: rather than weighting intervals by (nd)0.5, we choose a different exponent, such as (nd)2. For an exponent which is large enough (we will show that it must be greater than 1), HE does indeed converge as N → ∞, and we show that this yields an expression related to the Riemann zeta function. We can then use the analytic continuation of the zeta function to obtain an analytically continued curve for the (nd)0.5 weighting, which we then show empirically does indeed appear to be what HE converges on for large values of N.
In short, what we will show is that the Fourier Transform of this unnormalized harmonic Shannon entropy is given by
$$|\zeta(0.5+it)|^2 \cdot \overline {\phi(t)}$$
where φ(t) is the characteristic function of the spreading distribution and φ(t) is complex conjugation. Below we also give an expression for the Rényi entropy for arbitrary choice of the parameter a.
This enables us to speak cognizantly of the harmonic entropy of an interval as measured against all rational numbers.
Background: unnormalized entropy
Our derivation only analytically continues the entropy function for the "unnormalized" set of probabilities, which we previously wrote as Q(j|c). For this definition to be philosophically perfect, we would want to analytically continue the entropy function for the normalized sense of probabilities, previously written as P(j|c).
However, in practice, the "unnormalized entropy" appears to be an extremely good approximation to the normalized entropy for large values of N. The resulting curve has approximately the same minima and maxima as HE, the same general shape, and for all intents and purposes looks exactly like HE, just shifted on the y-axis.
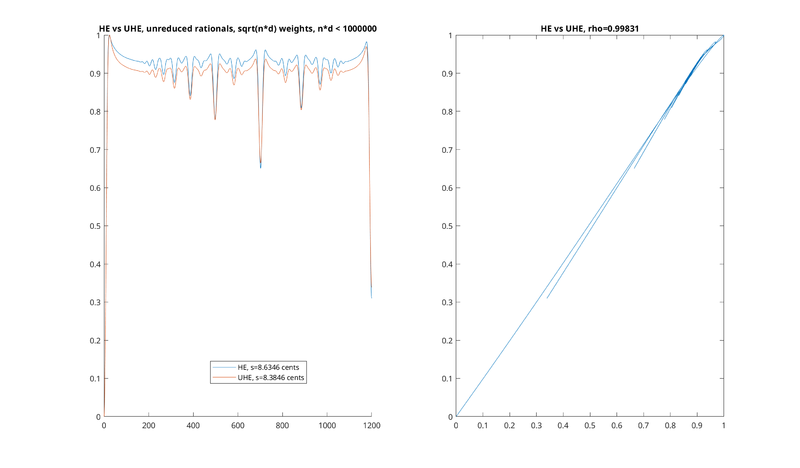
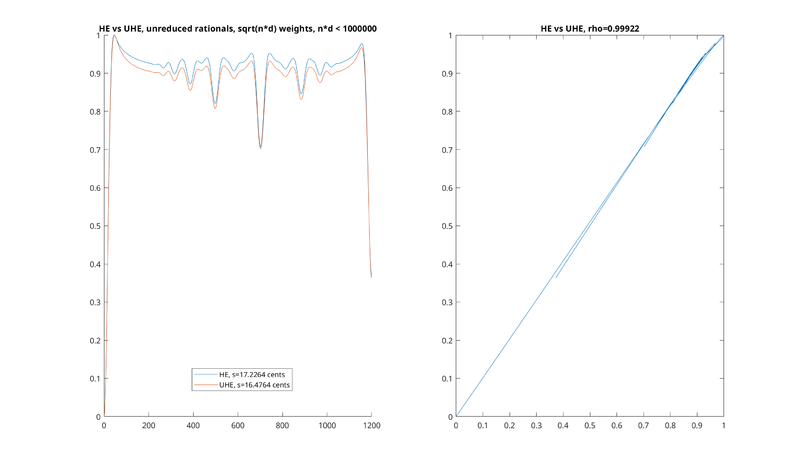
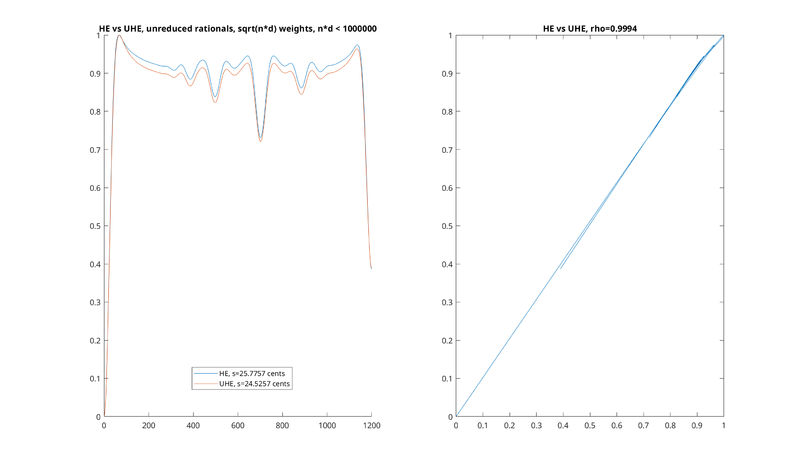
Here are some examples for different values of s. All of these are Shannon HE ([math]\displaystyle{ a=1 }[/math]), using [math]\displaystyle{ \sqrt{nd} }[/math] weights, with unreduced rationals (more on this below), with the bound that nd < 1,000,000, just with different values of s. All have been scaled so that the minimum entropy is 0, and the maximum entropy is 1:
As you can see, the unnormalized version is extremely close to a linear function of the normalized one. A similar situation holds for larger values of a. The Pearson correlation coefficient of ρ is also given, and is typically very close to 1—for example, for s = 1%, it's equal to 0.99922. The correlation also seems to get better with increasing values of N, such that the correlation for N=1,000,000 (shown above) is much better than the one for N = 10,000 (not pictured).
In the above examples, note that there are slightly adjusted values of s (usually by < 1 ¢) between the normalized and unnormalized comparisons for each plot. For example, in the plot for s = 1%, corresponding to 17.2264 ¢, we compare to a slightly adjusted UHE of 16.4764 ¢. This is because, empirically, sometimes a very slight adjustment corresponds to a better correlation coefficient, suggesting that the UHE may be equivalent to the HE with a miniscule adjustment in the value of s.
It would be nice to show the exact relationship of unnormalized entropy to the normalized entropy in the limit of large N, and whether the two converge to be exactly equal (perhaps given some miniscule adjustment in s or a). However, we will leave this for future research, as well as the question of how to do an exact derivation of normalized HE.
For now, we will start with a derivation of the unnormalized entropy for N = ∞, as an interesting function worthy of study in its own right—not only because it looks exactly like HE, but because it leads to an expression for unnormalized HE in terms of the Riemann zeta function.
Derivation
For now, our derivation is limited to the case of [math]\displaystyle{ \sqrt{nd} }[/math] Tenney-weighted rationals, although it may be possible to derive a similar result for max(n, d) weighting as well.
Additionally, because it simplifies the derivation, we will use unreduced rationals in our basis set, meaning that we will even allow unreduced fractions such as 4/2 so long as nd < N for our bound N. The use of HE with unreduced rationals has previously been studied by Paul and shown to be not that much different than HE with reduced ones. However, we will easily show later unreduced and reduced rationals converge to the same thing in the limit as N → ∞, up to a constant multiplicative scaling.
Definition of the unnormalized harmonic Rényi entropy
Let's start by recalling the original definition for harmonic Rényi entropy, using simple weighted probabilities:
$$\displaystyle \text{HE}_a(c) = \frac{1}{1-a} \log \sum_{j \in J} P(j|c)^a$$
Remember also that the definition of P(j|c) is as follows:
$$\displaystyle P(j|c) = \frac{Q(j|c)}{\sum_{j \in J} Q(j|c)}$$
where the Q(j|c) is the "unnormalized probability"—the raw value of the spreading function, evaluated at the ratio in question, divided by the ratio's weighting. The above equation tells us that the normalized probability is equal to the unnormalized probability, divided by the sum of all unnormalized probabilities.
Putting the two together, we get
$$\displaystyle \text{HE}_a(c) = \frac{1}{1-a} \log \sum_{j \in J} \left( \frac{Q(j|c)}{\sum_{j \in J} Q(j|c)} \right)^a$$
Now, for us to define the unnormalized HE, we simply take the standard Rényi entropy equation, and replace the normalized probabilities with unnormalized ones, yielding
$$\displaystyle \text{UHE}_a(c) = \frac{1}{1-a} \log \sum_{j \in J} Q(j|c)^a$$
Using our convolution theorem from before, we can express the above as
$$\displaystyle \text{UHE}_a(c) = \frac{1}{1-a} \log \left( S^a \ast K^a \right)(-c)$$
where, as before, Sa is our spreading function, taken to the ath power, and Ka is our convolution kernel, with the weights on the delta functions taken to the ath power as described previously.
Note that if S is symmetric, as in the case of the Gaussian or Laplace distributions, then the inverted argument of (−c) on the end is redundant, and can be replaced by (c).
Lastly, it so happens that it will be much easier to understand our analytic continuation if we look at the exponential of the UHE times (1 − a), rather than the UHE itself. The reasons for this will become clear later. If we do so, we get
$$\displaystyle \exp((1-a) \text{UHE}_a(c)) = \left( S^a \ast K^a \right)(-c)$$
Note that this function is simply a monotonic transformation of the original, and so preserves the exact same concordance ranking on all intervals.
Analytic continuation of the convolution kernel
The definition for K is:
$$\displaystyle K(c) = \sum_{j \in J} \frac{\delta_{-\cent(j)}}{\|j\|}$$
where |j| represents the weighting of the JI basis ratio j. In the particular case of Tenney weighting, we get:
$$\displaystyle K(c) = \sum_{j \in J} \frac{\delta_{-\cent(j)}}{(j_n \cdot j_d)^{0.5}}$$
where jn and jd are the numerator and denominator of j, respectively.
Although it may seem odd, we can take the Fourier transform of the above to obtain the following expression:
$$\displaystyle \mathcal{F}\left\{K(c)\right\}(t) = \sum_{j \in J} \frac{e^{i t \cent(j)}}{(j_n \cdot j_d)^{0.5}}$$
Furthermore, for simplicity, we can change the units, so that rather than the argument being given in cents, it is given in "natural" units of "nepers", a technique often used by Martin Gough in his work on logarithmic approximants. The representation of any interval in nepers is given by simply taking is natural logarithm. Doing so, by defining the change of variables c = 1200/log(2)n, we obtain
$$\displaystyle \mathcal{F}\left\{K(n)\right\}(t) = \sum_{j \in J} \frac{e^{i t \log (j_n/j_d)}}{(j_n \cdot j_d)^{0.5}}$$
We can treat the presence of the logarithm within the exponential function as changing the base of the exponential, so that we get
$$\displaystyle \mathcal{F}\left\{K(n)\right\}(t) = \sum_{j \in J} \frac{(j_n/j_d)^{i t}}{(j_n \cdot j_d)^{0.5}}$$
We can also factor each term in the summation to obtain
$$\displaystyle \mathcal{F}\left\{K(n)\right\}(t) = \sum_{j \in J} \left[ \frac{{j_n}^{i t}}{j_n^{0.5}} \cdot \frac{{j_d}^{-i t}}{j_d^{0.5}} \right]$$
which we can rewrite as
$$\displaystyle \mathcal{F}\left\{K(n)\right\}(t) = \sum_{j \in J} \left[ \frac{1}{{j_n}^{0.5 -i t}} \cdot \frac{1}{{j_d}^{0.5 + i t}} \right]$$
Now, we note our summation is currently written simply as [math]\displaystyle{ \sum_{j \in J} }[/math]. For a Tenney height weighting, we typically bound by [math]\displaystyle{ \sqrt{nd} \lt N }[/math] for some N. However, although it is unusual, for the sake of simplifying the derivation, we will bound by max(n, d) < N instead, despite the use of Tenney height for our weighting. This will not end up being much of a problem, as the two will converge on the same result anyway.0
Bounding by max(n, d) < N is the same as specifying that jn < N and jd < N. Doing so, we get
$$\displaystyle \mathcal{F}\left\{K(n)\right\}(t) = \sum_{1\leq j_n, j_d<N} \left[ \frac{1}{{j_n}^{0.5 -i t}} \cdot \frac{1}{{j_d}^{0.5 + i t}} \right]$$
We can now factor the above product to obtain:
$$\displaystyle \mathcal{F}\left\{K(n)\right\}(t) = \left[ \sum_{j_n=1}^N \frac{1}{{j_n}^{0.5 -i t}} \right] \cdot \left[ \sum_{j_d=1}^N\frac{1}{{j_d}^{0.5 + i t}} \right]$$
Now, we can see that as N → ∞ above, the summations do not converge. However, incredibly enough, each of the above expressions has a very well-known analytic continuation, which is the Riemann zeta function.
To perform the analytic continuation, we temporarily change the 0.5 in the denominator to some other weight w > 1. This is equivalent to changing our original [math]\displaystyle{ \sqrt{nd} }[/math] weighting to some other exponent, such as (nd)2 or (nd)1.5. Doing this causes both of the summations above to converge, so that we obtain
$$\displaystyle \mathcal{F}\left\{K(n)\right\}(t) = \left[ \sum_{j_n=1}^\infty \frac{1}{{j_n}^{w -i t}} \right] \cdot \left[ \sum_{j_d=1}^\infty\frac{1}{{j_d}^{w + i t}} \right]$$
It has been well known for more than a century that both of these summations converge to the Riemann zeta function, so that we get
$$\displaystyle \mathcal{F}\left\{K(n)\right\}(t) = \zeta(w-i t) \cdot \zeta(w+i t)$$
Rewriting as a function of a complex variable z = w + it, and noting that the zeta function obeys the property that ζ(z) = ζ(z), where s represents complex conjugation, we get
$$\displaystyle \mathcal{F}\left\{K(n)\right\}(t) = \overline{\zeta(z)} \cdot \zeta(z) = |\zeta(z)|^2$$
And we have now obtained a very interesting result: if we had instead gone with something like (nd)2 weighting on rationals, rather than [math]\displaystyle{ \sqrt{nd} }[/math], that our HE setup would have converged as N → ∞, and our original HE convolution kernel would have been the Fourier transform of a particular vertical "slice" of the Riemann zeta function where Re(z) = 2.
Furthermore, although the above series doesn't converge for w = 0.5, we can simply use the analytic continuation of the Riemann zeta function to obtain a meaningful function at that point, so that our original convolution kernel can be written as
$$\displaystyle K(n) = \mathcal{F}^{-1}\left\{| \zeta(0.5+ t) |^2\right\}(n)$$
which is the inverse Fourier transform of the squared absolute value of the Riemann zeta function, taken at the critical line.
Lastly, to do some cleanup, we previously went with [math]\displaystyle{ \max(n,d) \lt N }[/math] bounds, rather than [math]\displaystyle{ \sqrt{nd} \lt N }[/math] bounds, despite using [math]\displaystyle{ \sqrt{nd} }[/math] weighting on ratios. However, it is easy to show above that regardless of which bounds you use, both choices converge to the same function when w > 1 in the limit as N → ∞. Since these series agree on this right half-plane of the Riemann zeta function, they share the same analytic continuation, so that we get the same result, despite using our technique to simplify the derivation. A good explanation fo this can be found on StackExchange here.
It is likewise easy to show that the function Ka(n), taken from the numerator of our original Harmonic Rényi Entropy convolution expression, can be expressed as
$$\displaystyle K^a(n) = \mathcal{F}^{-1}\left\{|\zeta(0.5a+ t) |^2\right\}(n)$$
so that the choice of a simply changes our choice of vertical slice of the Riemann zeta function, as well as the shape of our spreading function (because it is also being raised to a power). If our spreading function is a Gaussian, then we simply get another Gaussian with a different standard deviation.
Analytic continuation of unnormalized harmonic Rényi entropy
We can put this back into our equation for the unnormalized harmonic Rényi entropy. To do so, we will continue with our change of units from cents to nepers, corresponding to a change of our variable from c to n. We will likewise assume the spreading probability distribution S has been scaled to reflect the new choice of units.
Our original equation was
$$\displaystyle \exp((1-a) \text{UHE}_a(n)) = \left( S^a \ast K^a \right)(-n)$$
Using our expression for Ka as N → ∞, we get
$$\displaystyle \exp((1-a) \text{UHE}_a(n)) = \left( S^a \ast \mathcal{F}^{-1}\left\{|\zeta(0.5a+ t)|^2\right\} \right)(-n)$$
To simplify this, we will define an auxiliary notation for the zeta function as follows:
$$\zeta_w(t) = \zeta(w + i t)$$
yielding the simplified expression:
$$\displaystyle \exp((1-a) \text{UHE}_a(n)) = \left( S^a \ast \mathcal{F}^{-1}\left\{|\zeta_{0.5a}|^2\right\} \right)(-n)$$
We can simplify the expression of the above if we likewise take the Fourier transform of S. If we do, we obtain the characteristic function of the distribution, which is typically denoted by φ(t). We will use the following definitions:
$$\displaystyle \phi(t) = \mathcal{F}\left\{S(n)\right\}(t)$$
$$\displaystyle \phi_a(t) = \mathcal{F}\left\{S(n)^a\right\}(t)$$
Doing so, and noting that convolution becomes multiplication in the Fourier domain, we get
$$\displaystyle \exp((1-a) \text{UHE}_a(n)) = \mathcal{F}^{-1}\left\{\phi_a \cdot |\zeta_{0.5a}|^2\right\}(-n)$$
Lastly, we note that for any real function f(x), we have ℱ{f(−x)} = ℱ{f(x)}. For simplicity's sake, we can this write as ℱ{f(x)}. Putting that all together, we get
$$\displaystyle \exp((1-a) \text{UHE}_a(n)) = \mathcal{F}^{-1}\left\{\overline \phi_a \cdot |\zeta_{0.5a}|^2\right\}$$
where we can drop the overline on |ζ0.5a|2 because it is purely real, and its complex conjugate is itself.
Examples
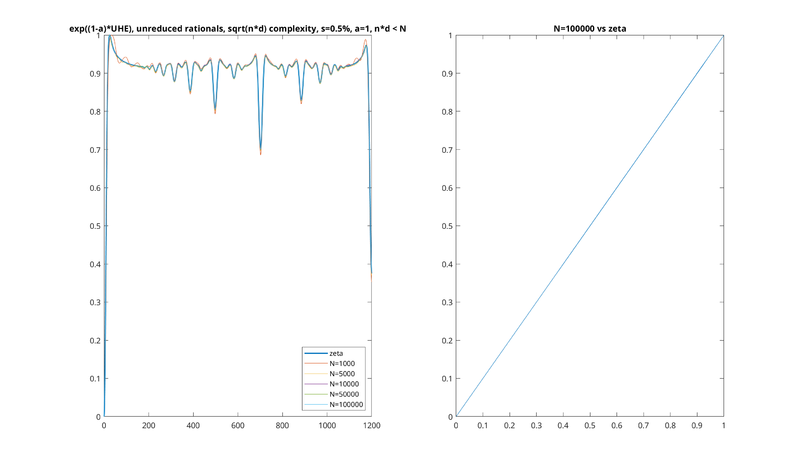
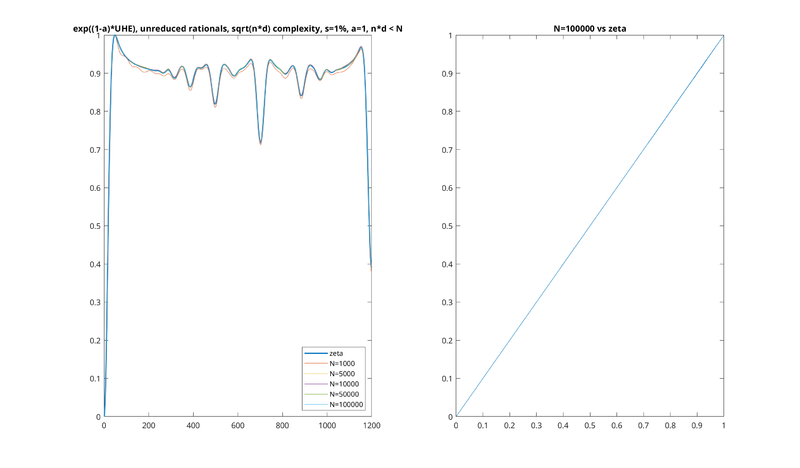
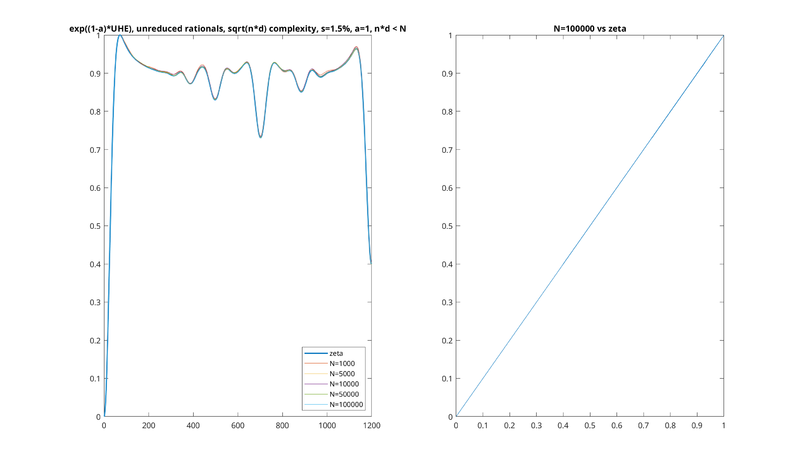
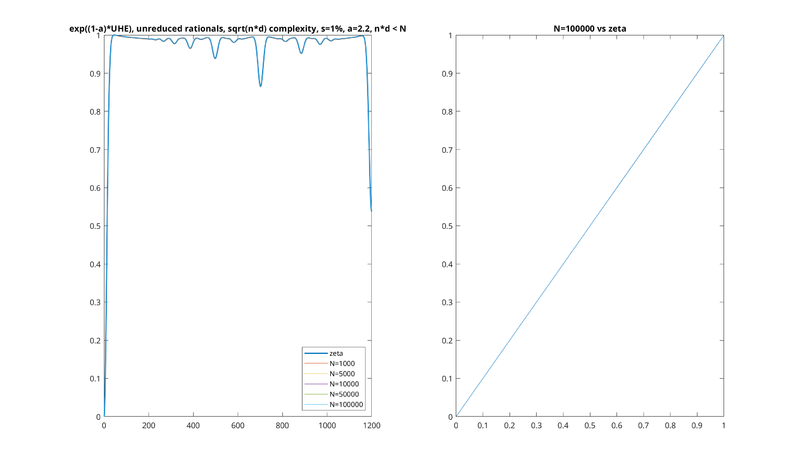
It is very easy to see empirically that our expression does seem to converge be the thing that UHE converges on in the limit of large N. Here are some examples for different values of s and a, showing that as N increases it converges on the our analytically continued "zeta HE."
In all these examples, the left plot is a series of plots of UHE at different N, with the zeta HE being a slightly thicker line in the background. The right plot is the largest N plotted against zeta HE, being almost a perfect line.
Note also that we don't plot the UHE directly, but rather e(1 − a)UHEa, as described previously. The units have also been converted back to cents. Each HE function has been scaled so that the minimum entropy is 0 and the maximum entropy is 1.
Lastly, note that, due to our multiplication of UHE by 1 − a above, the UHE would be flipped upside down relative to what we're used to, with higher values corresponding to more concordant intervals. In the pictures below we have flipped it back upside down, for consistency with the earlier pictures.
s = 0.5%, a = 1.00001
s = 1%, a = 1.00001
s = 1.5%, a = 1.00001
Note that in all these plots, the value of a is chosen to be 1.00001 rather than exactly 1, so as to prevent the (1 − a) term becoming 0. Similar results are seen for other choices of a:
s = 1%, a = 2.2
Note that you have to be careful if you choose to compute the analytically continued a = 2 numerically: this corresponds to the vertical slice of zeta function at Re(z) = 1, where there is a pole.
Apparent equivalence of exp-UHE and UHE for a ≤ 2
Note: this section is for future research; some of it needs to be put on more rigorous footing, but we've left it as it's certainly interesting.
Let's go back to our original convolution expression for finite-N UHE:
$$\displaystyle \text{UHE}_a(c) = \frac{1}{1-a} \log \left(\left( S^a \ast K^a \right)(-c)\right)$$
We will also, for now, use the notation
$$U(c) = \exp((1-a) \text{UHE}_a(c)) = \left( S^a \ast K^a \right)(-c)$$
to get
$$\displaystyle \text{UHE}_a(c) = \frac{1}{1-a} \log U(c)$$
Now let's consider the auxiliary function Ũ(c) = U(c) − U(0), which gives us a "shifted" version of the UHE which has the UHE of 1/1 normalized to 0. Then we can re-express the UHE as follows:
$$\displaystyle \text{UHE}_a(c) = \frac{1}{1-a} \log \left(U(0) + \tilde{U}(c) \right)$$
Lastly, suppose we only care about the entropy function up to a vertical shift and scaling: in other words, we want to declare two functions (f(x), g(x) to be linearly equivalent, and write f(x) ≈ g(x), if for some a, b that don't depend on x, we have f(x) = a g(x) + b. This means we want to view two entropy functions as equivalent if one is just a scaled and shifted version of the other, so that when "normalizing" them (so that the entropy goes from 0 to 1), we get identical functions. Then we have all of the following relationships:
$$\displaystyle \text{UHE}_a(c) \approx \log U(c) \approx \log \left( U(c)^{\frac{1}{1-a}} \right)$$ $$U(c) \approx \tilde{U}(c)$$
where we have just dropped the constants of 1/1 − a and the constant vertical shift of U(0) which doesn't depend on c.
Now, the main thing is that, if we are in the region where a ≤ 2, then this is also the region where the U(0) term goes to infinity as N increases: the entropy doesn't converge. And in general, we have the asymptotic expansion
$$ \displaystyle \log(k + x) \sim \log(k) + x/k + \ldots $$
and, for large k, as long as x ≪ k, the higher-order terms become negligible. This means, for all c, we would need to show that Ũ(c) ≪ U(0) as N → ∞. We would then be able to rewrite the above as
$$\displaystyle \log U(c) \sim \frac{1}{1-a} \left (\log (U(0)) + \frac{\tilde{U}(c)}{U(0)} \right)$$
This means that, as N → ∞, we would also get the following linear equivalence:
$$\displaystyle \text{UHE}_a(c) \approx \tilde{U}(c)$$
Putting this with our earlier result that U(c) ≈ Ũ(c), we get
$$\displaystyle \text{UHE}_a(c) \approx U(c) \approx \log U(c)$$
Now, to get the exp-UHE directly, we substitute in from our earlier definition to note
$$ \displaystyle \exp(\text{UHE}_a(c)) = U(c)^{\frac{1}{1-a}} $$
We can perform the same substitution of U(c) = U(0) + Ũ(c) again to get
$$ \displaystyle \exp(\text{UHE}_a(c)) = \left( U(0) + \tilde{U}(c) \right)^{\frac{1}{1-a}} $$
Given that a ≠ 0, we have a Taylor expansion of (k + x)1/1 − a around x = 0 of the form
$$ \displaystyle k^{\frac{1}{1-a}}\left(1 + \frac{x}{k(1-a)} + \frac{x^2}{2k^2(1-a)^2} + \ldots\right) $$
where we have factored out the leading term for clarity. Now, again, we have that if x ≪ k—meaning that Ũ(c) ≪ U(0)—then the higher-order terms become negligible, and we simply have the asymptotic relationship of
$$ \displaystyle \exp(\text{UHE}_a(c)) \sim U(0)^{\frac{1}{1-a}}\left(1 + \frac{\tilde U(c)}{U(0)(1-a)} \right) $$
Lastly, we note that for any particular choice of a and N, the above is simply linearly equivalent to
$$ \displaystyle U(0)^{\frac{1}{1-a}}\left(1 + \frac{\tilde U(c)}{U(0)(1-a)}\right) \approx \tilde U(c) $$
So that, overall, as N → ∞, the following equivalence holds:
$$ \displaystyle \exp(\text{UHE}_a(c)) \approx \tilde{U}(c) $$
And since we have already shown that UHEa(c) ≈ Ũ(c), we have
$$ \displaystyle \exp(\text{UHE}_a(c)) \approx \text{UHE}_a(c) $$
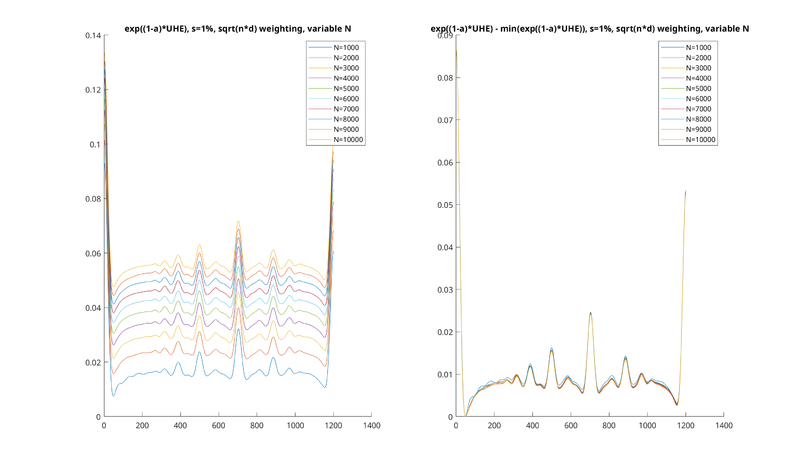
Now, the only missing piece needed for all of this is to show that we really do have Ũ(c) ≪ U(0) in the region of interest. For now, absent mathematical proof, we will simply plot the behavior for the Shannon entropy as N → ∞.
What we see is that, while the function diverges, it diverges in a certain "uniform" sense. That is, as N increases, a constant vertical offset is added to U(c), so that the function blows up to infinity. However, if this vertical offset is corrected for, for example by subtracting U(0), the resulting curve doesn't seem to grow at all, but rather shrinks in height slightly until it seems to converge. We would like to prove this formally, but for now, we can at least see this from the following plot:
In other words, we can see that as N increases, the growth rate of U(0) dwarfs that of Ũ(c)</math>, which does not seem to grow at all.
So, this is a fairly weak conjecture to make, given that empirical evidence suggests something much stronger—that not only does it grow more slowly, but that it seems to not grow at all—it converges! In particular, it seems to converge on our analytic continuation from before. However, a strict proof of any of these things would be nice.
Note again that this does not hold for a > 2, where the graph does display a very large difference between UHE and exp-UHE.
Why not normalized HE?
On the surface, everything we did with the convolution theorem, and subsequent analytic continuation, should appear to work for normalized HE as well. For example, let's review our result for the exp of unnormalized HE:
$$\displaystyle \exp((1-a) \text{UHE}_a(n)) = \mathcal{F}^{-1}\left\{\overline \phi_a \cdot |\zeta_{0.5a}|^2\right\}$$
Our original expression for normalized HE was
$$\displaystyle \exp((1-a) \text{HE}_a(n)) = \frac{\left[S^a \ast K^a\right](-c)}{\left[S \ast K\right]^a(-c)}$$
Naively, you might expect we could simply apply the same analytic continuation technique to the numerator and denominator. If we do so, we would get
$$\displaystyle \exp((1-a) \text{HE}_a(n)) = \frac{\mathcal{F}^{-1}\left\{\overline \phi_a \cdot |\zeta_{0.5a}|^2\right\}}{\mathcal{F}^{-1}\left\{\overline \phi \cdot |\zeta_{0.5}|^2\right\}^a}$$
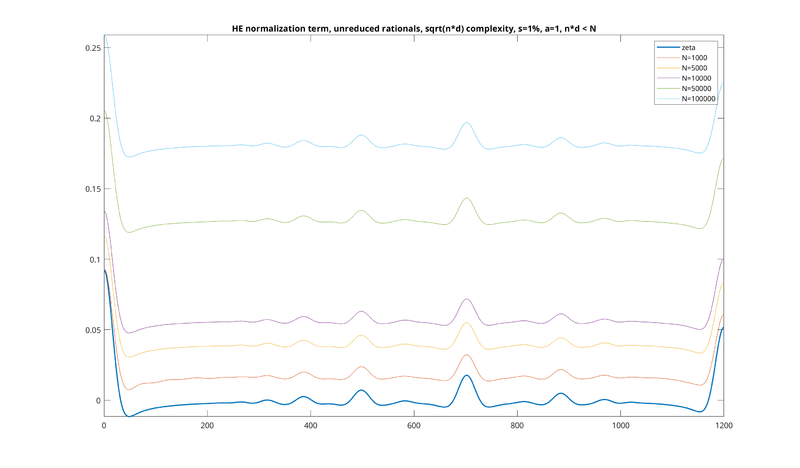
However, to see why this doesn't work, let's compare the analytically continued version of the denominator (i.e. the normalization term) with the finite versions. Look at the following picture, which is a plot of ℱ−1{φ · |ζ0.5|2}a:
This picture shows how the denominator changes as N increases: you can see that in general, the function is shifted upward, increasing without bound. The thin plots reflect this for N = 1000, 5000, 10000, 50000, and 100000, where you can see them increasing.
You will note that the denominator also looks exactly like unnormalized HE, just upside down. Normalized HE is the quotient of two functions that both look like this, which are slightly different. This quotient produces the usual HE curve, which is flipped upside down relative to the denominator, and which also increases without bound. That all these functions increase without bound is just another way to state that these things generally don't converge as N → ∞.
However, look at what happens with our analytic continuation, which is given by the thicker blue line at the bottom. Despite our sequence of finite-N denominator terms increasing on the y-axis, the analytically continued version suddenly "snaps" back to zero. Although the curve shape is roughly the same, the vertical offset is almost completely eliminated when the analytic continuation is done.
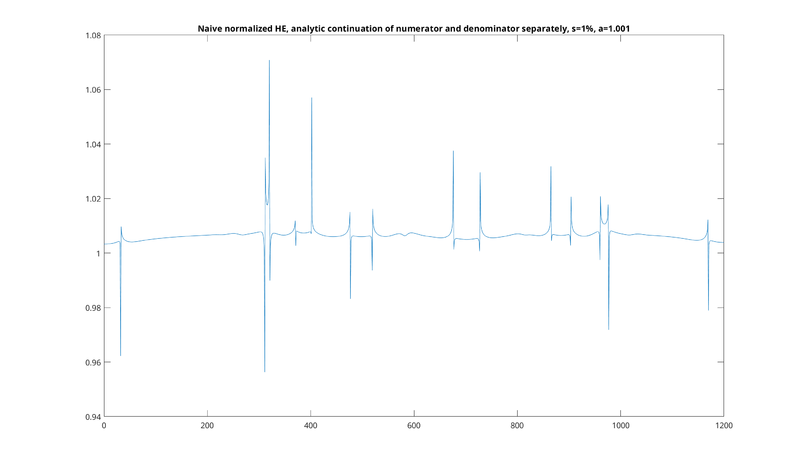
The problem here is that the original HE function was the quotient of two very large, strictly positive functions: the numerator and denominator. However, performing the analytic continuation on each separately has caused both to "snap" back to zero, so that the denominator, while retaining the same shape, now has points where it touches the x-axis. As a result, the quotient of the two will have poles where the denominator is zero.
The resulting quotient of analytically continued functions looks like this, and does not remotely resemble HE:
Those "spikes" are poles where the denominator is zero.
The problem is that we're really stretching the boundaries of complex analysis with this. With unnormalized HE, we were able to analytically continue the Fourier transform of exp-UHE to obtain a concrete expression in terms of the Riemann zeta function. While complex analysis makes no guarantees on the behavior of the Fourier transform of the analytic continuation of a holomorphic function, we did see the result seemed to converge on exp-UHE in the limit of large N when transforming back from the Fourier domain, confirming empirically that our analytically continued expression seemed to make sense.
But in the case of "normalized HE," we analytically continued the Fourier transforms of the numerator and denominator, separately, transformed both out of the Fourier domain, and then took the quotient. Complex analysis really makes no guarantee on the behavior of the quotient of two Fourier transforms of the analytic continuations of holomorphic functions, and in this case the behavior is very strange. A different approach to analytically continuing the expression would be required.
This same principle explains why we plotted the exp of UHE, rather than UHE itself. Were we to take the log of finite UHE, we would be taking the log of a strictly positive function. However, the analytically continued exp-UHE snaps back to the x-axis, so that there are points where the function is zero or even negative. Taking the log of the analytically continued exp-UHE would yield a complex-valued function where it is negative, due to this snapping effect. However, looking at exp-UHE directly has no such problem.
Finally, it is noteworthy that for a > 2, we end up looking at slices of the zeta function for which Re(z) > 1. This is where our original unnormalized HE function should converge as N → ∞, corresponding to the region where the Riemann zeta function Dirichlet series converges. For these values of a, the exp-UHE is positive. So, we can take the log again and look at the usual UHE. This can be useful for plotting, since exp-UHE tends to "flatten" out the curve for high values of a, whereas taking the log accentuates the minima and maxima (and more closely resembles the usual HRE).
Interpretation as a new free parameter: the weighting exponent
In our original derivation of the analytic continuation, we temporarily changed the weighting for rationals from (nd)0.5 to some other (nd)w, with w > 1, for the sake of obtaining a series that converges. We then changed the exponent back to 0.5.
This can be thought of as giving us another free parameter to HE, in addition to s and a: the exponent for the weighting for each rational. That is, although Paul originally derived the (nd)0.5 exponent empirically by studying the behavior of mediant-to-mediant HE for Tenney-bounded rationals, there is no reason we can't simply that exponent to something else. As shown before, so long as that exponent is greater than 1, unnormalized HE will converge in the limit as N → ∞, and will converge to the same thing whether we are bounding nd < N, max(n, d) < N, or anything else (see again here). We can then analytically continue to the case where w < 1.
If we add this as a third parameter, called w we can modify our definition of exp-UHE as follows:
$$\displaystyle \exp((1-a) \text{UHE}_{a,w}(n)) = \mathcal{F}^{-1}\left\{\overline \phi_a \cdot |\zeta_{w a}|^2\right\}$$
So that our vertical slice of the zeta function is given by Re(z) = wa.
Equivalence of the weighting exponent and a for generalized normal distributions
We get a very interesting result if our spreading distribution is a generalized normal distribution, which a family that encompasses both the Gaussian and the Laplace distributions (sometimes referred to as the "Vos curve" in Paul's work).
Let's go back to our three-parameter definition of exp-UHE above:
$$\displaystyle \exp((1-a) \text{UHE}_{a,w}(n)) = \mathcal{F}^{-1}\left\{\overline \phi_a \cdot |\zeta_{w a}|^2\right\}$$
We can see that, in a sense, the need for both a and w is almost redundant. Their product specifies the vertical slice of the zeta function. If you set w = 0.5 and a = 1, corresponding to the Shannon entropy with [math]\displaystyle{ \sqrt{nd} }[/math] weighting, you get the same vertical slice as if you set w = 0.25 and w = 2, corresponding to the collision entropy with [math]\displaystyle{ ^4\sqrt{nd} }[/math] weighting: in both cases this is the critical line of the zeta function.
The only reason that these expressions are different is due to the φa above. We had previously defined that as:
$$\displaystyle \phi_a(t) = \mathcal{F}\left\{S(n)^a\right\}(t)$$
or, the Fourier transform of the spreading distribution, raised to the power of a. So if you hold the product wa as constant, but change the balance of w and a, you will indeed get different results, simply because only the choice of a changes the φa.
However, we get a very neat result if we are using the generalized normal distribution. In that case, if we take the generalized normal distribution to a power a, we get another instance of the same generalized normal distribution. The difference is, the variance will be divided by a1⁄β, where β is the shape parameter for the distribution (a value of 1 is the Laplace distribution, a value of 2 is the Gaussian distribution, etc). The whole distribution will also no longer have an integral of 1, since we have also raised the scaling coefficient to a power, but this won't change anything, as it just corresponds to a uniform scaling of the end result.
In practice, what this means is that if you are using one of the above distributions, and you change a, this is equivalent to changing the weighting exponent w, and tweaking the standard deviation s according to the above equation.
This gives us a very nice interpretation of our a coefficient from HRE: it basically represents the weighting exponent on the rationals, with a corresponding adjustment to the standard deviation. The collision entropy a = 2 with the standard weighting [math]\displaystyle{ \sqrt{nd} }[/math] is totally equivalent to the Shannon entropy a = 1 with the weighting nd on the rationals, so long as the value of s is adjusted according to the equation above. However, it should be noted that this definition only holds for the "unnormalized HRE" given above.
Reduced rationals only
In our derivation, we assumed the use of unreduced rationals. It turns out that with a minor adjustment, the same model gives us reduced rationals, up to a constant multiplicative scaling. Let's go back to our analytic continuation of the convolution kernel, for some arbitrary weighting:
$$\displaystyle \mathcal{F}\left\{K(n)\right\}(t) = \sum_{j \in J} \frac{e^{i t \log (j_n/j_d)}}{(j_n \cdot j_d)^{w}}$$
Now, suppose we want to analytically continue this so that the set J is the set of all reduced rational numbers. We can first do so by starting again with unreduced rationals, but expressing each rational not as n/d, but rather as n'/d' · c/c, where n' and d' are coprime, and c is the gcd of both. For example, we would express 6/4 as 3/2 · 2/2. Doing so, and assuming that we denote the set of unreduced rationals by U, we get the following equivalent expression of the same convolution kernel above:
$$\displaystyle \mathcal{F}\left\{K(n)\right\}(t) = \sum_{j \in \mathbb{U}} \frac{e^{i t \log (\frac{j_c j_{n'}}{j_c j_{d'}})}}{(j_c j_{n'} \cdot j_c j_{d'})^{w}} = |\zeta(w+i t)|^2$$
where the last equality is what we proved before. Note that this is the same exact function as before, just written such that the GCD of the unreduced fraction has an explicit term.
The [math]\displaystyle{ \frac{j_c}{j_c} }[/math] in the log in the numerator cancels out, but in the denominator we have an extra factor of [math]\displaystyle{ {j_c}^2 }[/math] to contend with. This yields
$$\displaystyle |\zeta(w+i t)|^2 = \sum_{j \in \mathbb{U}} \frac{e^{i t \log (\frac{j_{n'}}{j_{d'}})}}{({j_c}^2 \cdot j_{n'} j_{d'})^{w}} = \sum_{j \in \mathbb{U}} \left[ \frac{1}{{j_c}^{2w}} \cdot \frac{e^{i t \log (\frac{j_{n'}}{j_{d'}})}}{(j_{n'} j_{d'})^{w}} \right]$$
Now, assuming we have w > 1 and everything is absolutely convergent, we can factor this into a product of series as follows:
$$\displaystyle |\zeta(w+i t)|^2 = \left[ \sum_{j_c \in \mathbb{N}^+} \frac{1}{{j_c}^{2w}} \right] \cdot \left[ \sum_{j \in \mathbb{Q}} \frac{e^{i t \log (\frac{j_{n'}}{j_{d'}})}}{(j_{n'} j_{d'})^{w}} \right]$$
where the left summation now has jc ∈ ℕ+, the set of strictly positive rational numbers, and the right summation now has j ∈ ℚ the set of reduced rationals. Note again that the product above yields all unreduced rationals, thanks to the jc.
Now, note that that left series is, itself, just another Dirichlet series that converges to the zeta function. We have
$$\displaystyle |\zeta(w+i t)|^2 = \zeta(2w) \cdot \left[ \sum_{j \in \mathbb{Q}} \frac{e^{i t \log (\frac{j_{n'}}{j_{d'}})}}{(j_{n'} j_{d'})^{w}} \right]$$
and now we are done. The right series is the thing that we want, representing the Fourier transform of the convolution kernel where only reduced fractions are allowed. To get that, we simply divide the whole thing by ζ(2w):
$$\displaystyle \frac{|\zeta(w+i t)|^2}{\zeta(2w)} = \sum_{j \in \mathbb{Q}} \frac{e^{i t \log (\frac{j_{n'}}{j_{d'}})}}{(j_{n'} j_{d'})^{w}}$$
This function then becomes our new ℱ{K(n)}.
However, you will note that ζ(2w) is a constant not depending at all on t. As a result, the reduced rational kernel is exactly equal to the unreduced rational kernel, times a constant depending only on w. This means that when we take the inverse Fourier transform and convolve, the result for exp-UHE will likewise be identical, scaled only by a constant.
As a result, we have shown that we get the same exact results for reduced and unreduced rationals, differing only by a multiplicative scaling.
Lastly, you will note that for the special value w = 0.5, corresponding to the usual [math]\displaystyle{ \sqrt{nd} }[/math] weighting, we end up dividing by the term ζ(1). This is the only pole in the zeta function, so we wind up dividing by infinity, making the entire function zero, as pointed out by Martin Gough. However, as we can get arbitrarily close to w = 0.5 and still exhibit the behavior that the unreduced and reduced functions are scaled versions of one another, we can simply use the unreduced version of exp-UHE for w = 0.5 and consider it equivalent to reduced exp-UHE in the limit.
References
- Paul Erlich article
- William Sethares article
- Harmonic entropy (TonalSoft encyclopedia)
- Harmonic entropy group on Yahoo (archive)
- Harmonic entropy graph calculator (JavaScript)
See also
- Harmonic entropy of just intervals
- Low harmonic entropy linear temperaments
- User:Sintel/Validation of common consonance measures — an informal empirical study which calls into question the effectiveness of harmonic entropy for explaining consonance
