File:WilsonHeightIntegerLimit.png

Original file (2,320 × 1,020 pixels, file size: 94 KB, MIME type: image/png)
Summary
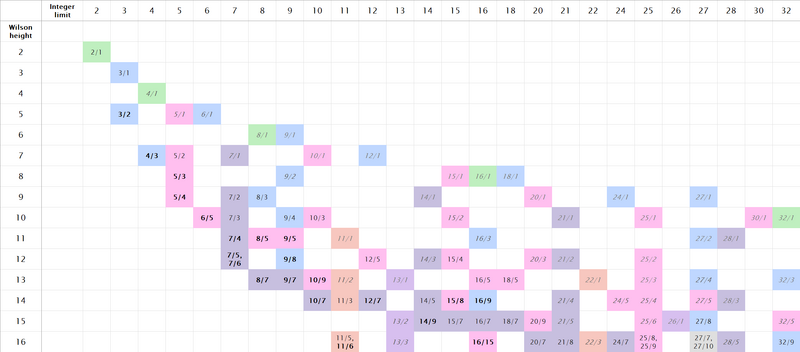
Diagram by Lériendil showing the Wilson height (vertical axis) versus integer limit (horizontal axis) of simple intervals. Cells are colored based on the prime limit of their interval (green for 2-limit, azure for 3-limit, pink for 5-limit, navy for 7-limit, red for 11-limit, purple for 13-limit; note that one cell is gray because it contains a 5-limit interval (27/10) and 7-limit interval (27/7) simultaneously). Text is formatted based on the octave the interval falls in (bold for intervals between 1/1 and 2/1, normal text between 2/1 and 4/1, dark gray italic between 4/1 and 8/1, and light gray italic above 8/1).
Licensing
File history
Click on a date/time to view the file as it appeared at that time.
| Date/Time | Thumbnail | Dimensions | User | Comment | |
|---|---|---|---|---|---|
| current | 02:39, 26 May 2025 | | 2,320 × 1,020 (94 KB) | BudjarnLambeth (talk | contribs) | Diagram by Lériendil showing the Wilson height (vertical axis) versus integer limit (horizontal axis) of simple intervals. |
You cannot overwrite this file.
File usage
The following 2 pages use this file: