File:Info types - flow chart.png
Jump to navigation
Jump to search


Size of this preview: 598 × 600 pixels. Other resolutions: 239 × 240 pixels | 479 × 480 pixels | 766 × 768 pixels | 1,021 × 1,024 pixels | 1,440 × 1,444 pixels.
Original file (1,440 × 1,444 pixels, file size: 134 KB, MIME type: image/png)
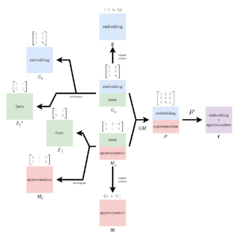
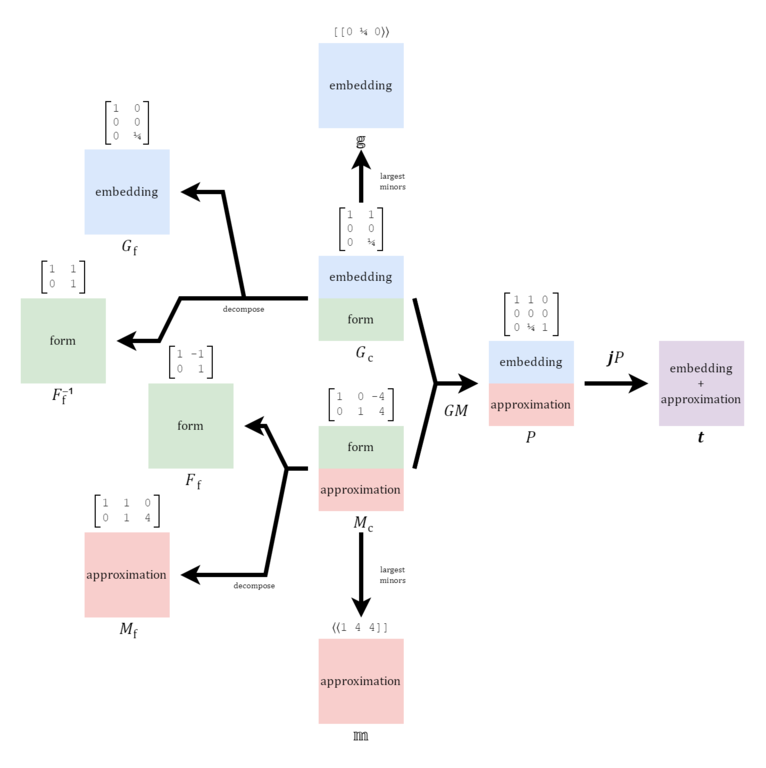
A diagram showing how the three information types (approximation, embedding, and form) break down across the tuning map, projection, mapping, generator embedding, multimap, and form matrices.
File history
Click on a date/time to view the file as it appeared at that time.
| Date/Time | Thumbnail | Dimensions | User | Comment | |
|---|---|---|---|---|---|
| current | 02:53, 10 January 2023 | | 1,440 × 1,444 (134 KB) | Cmloegcmluin (talk | contribs) | add missing labels |
| 19:31, 1 January 2023 | 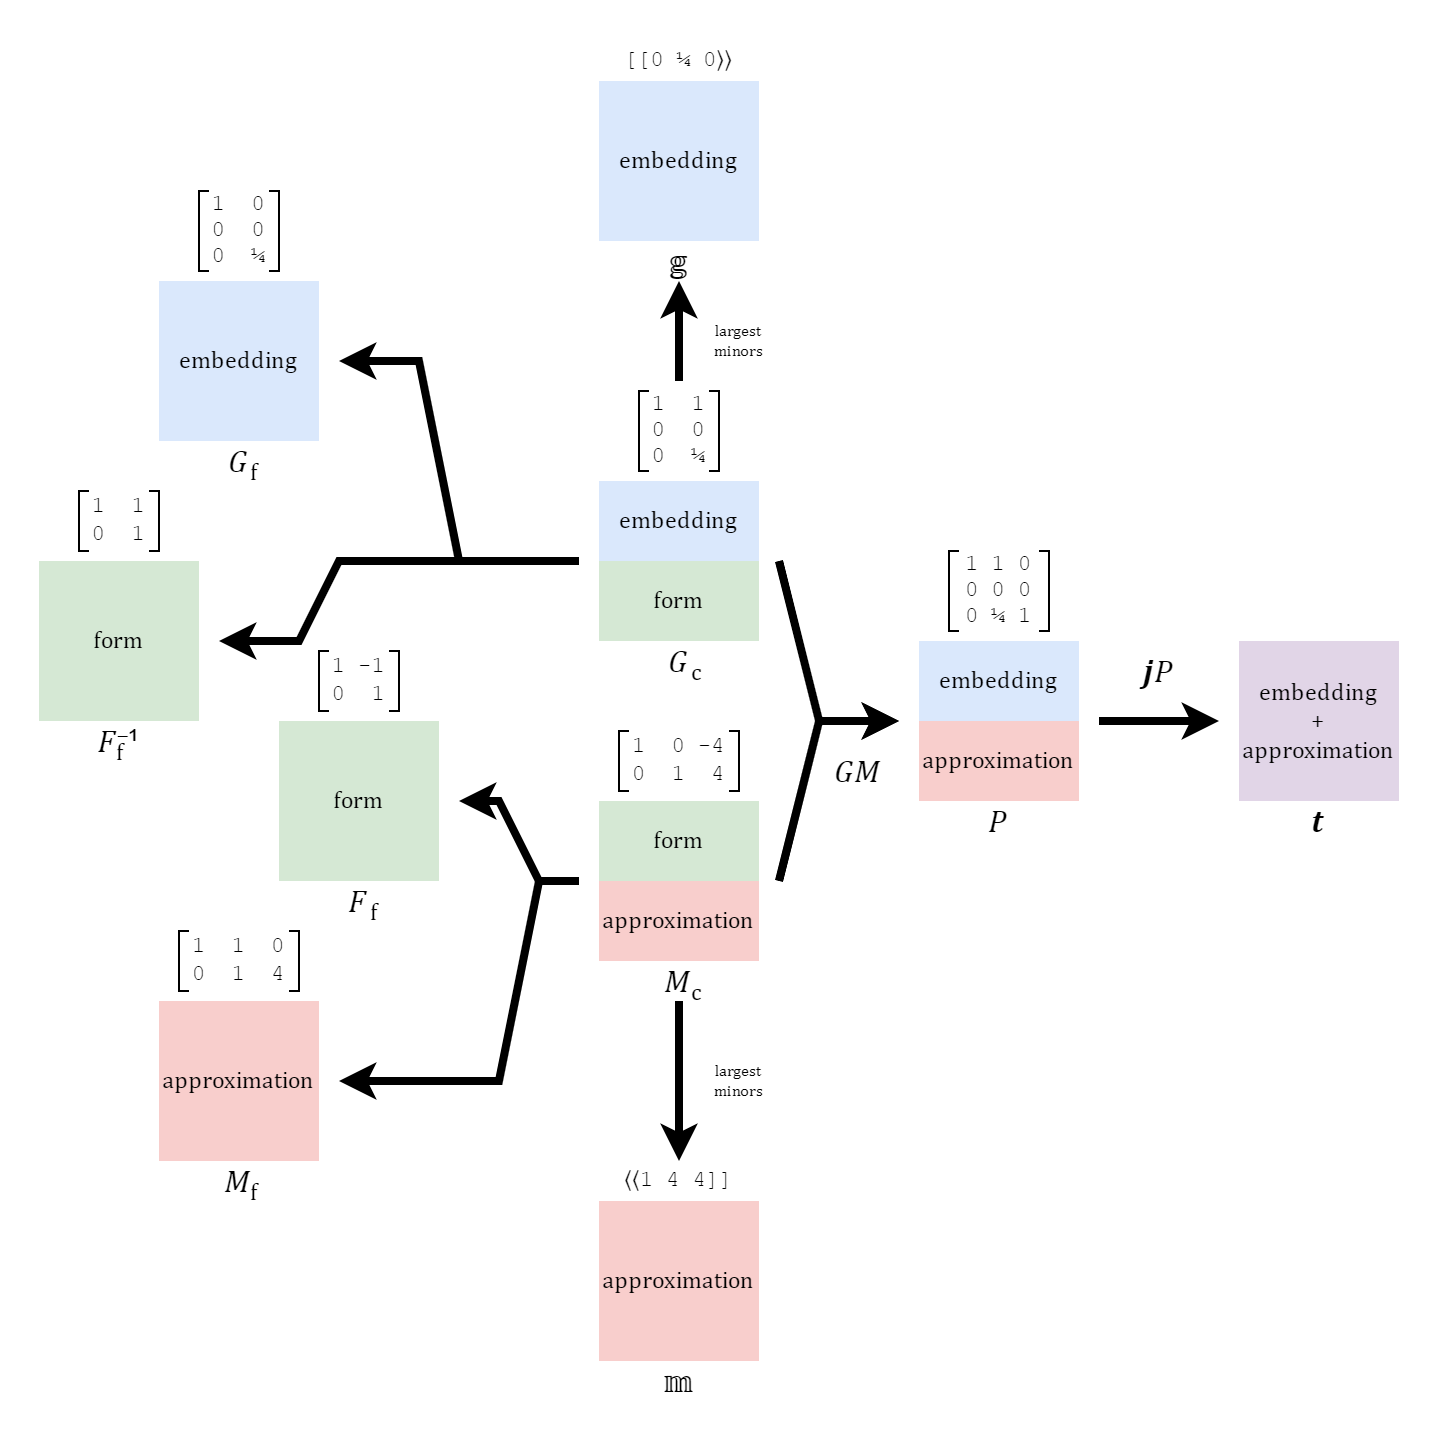 | 1,440 × 1,444 (82 KB) | Cmloegcmluin (talk | contribs) |
You cannot overwrite this file.
File usage
The following page uses this file: