File:Diatonic Function Map.png
Jump to navigation
Jump to search
Size of this preview: 222 × 600 pixels. Other resolutions: 89 × 240 pixels | 379 × 1,024 pixels.
Original file (379 × 1,024 pixels, file size: 15 KB, MIME type: image/png)
Summary
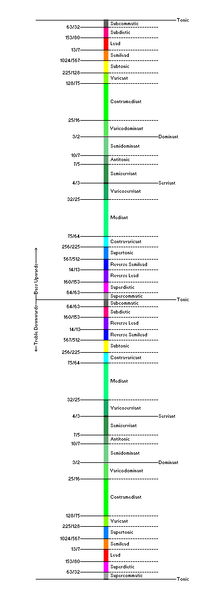
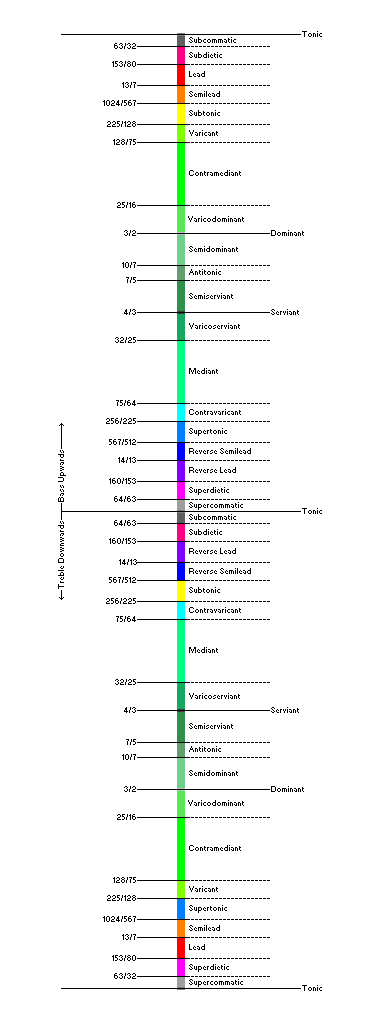
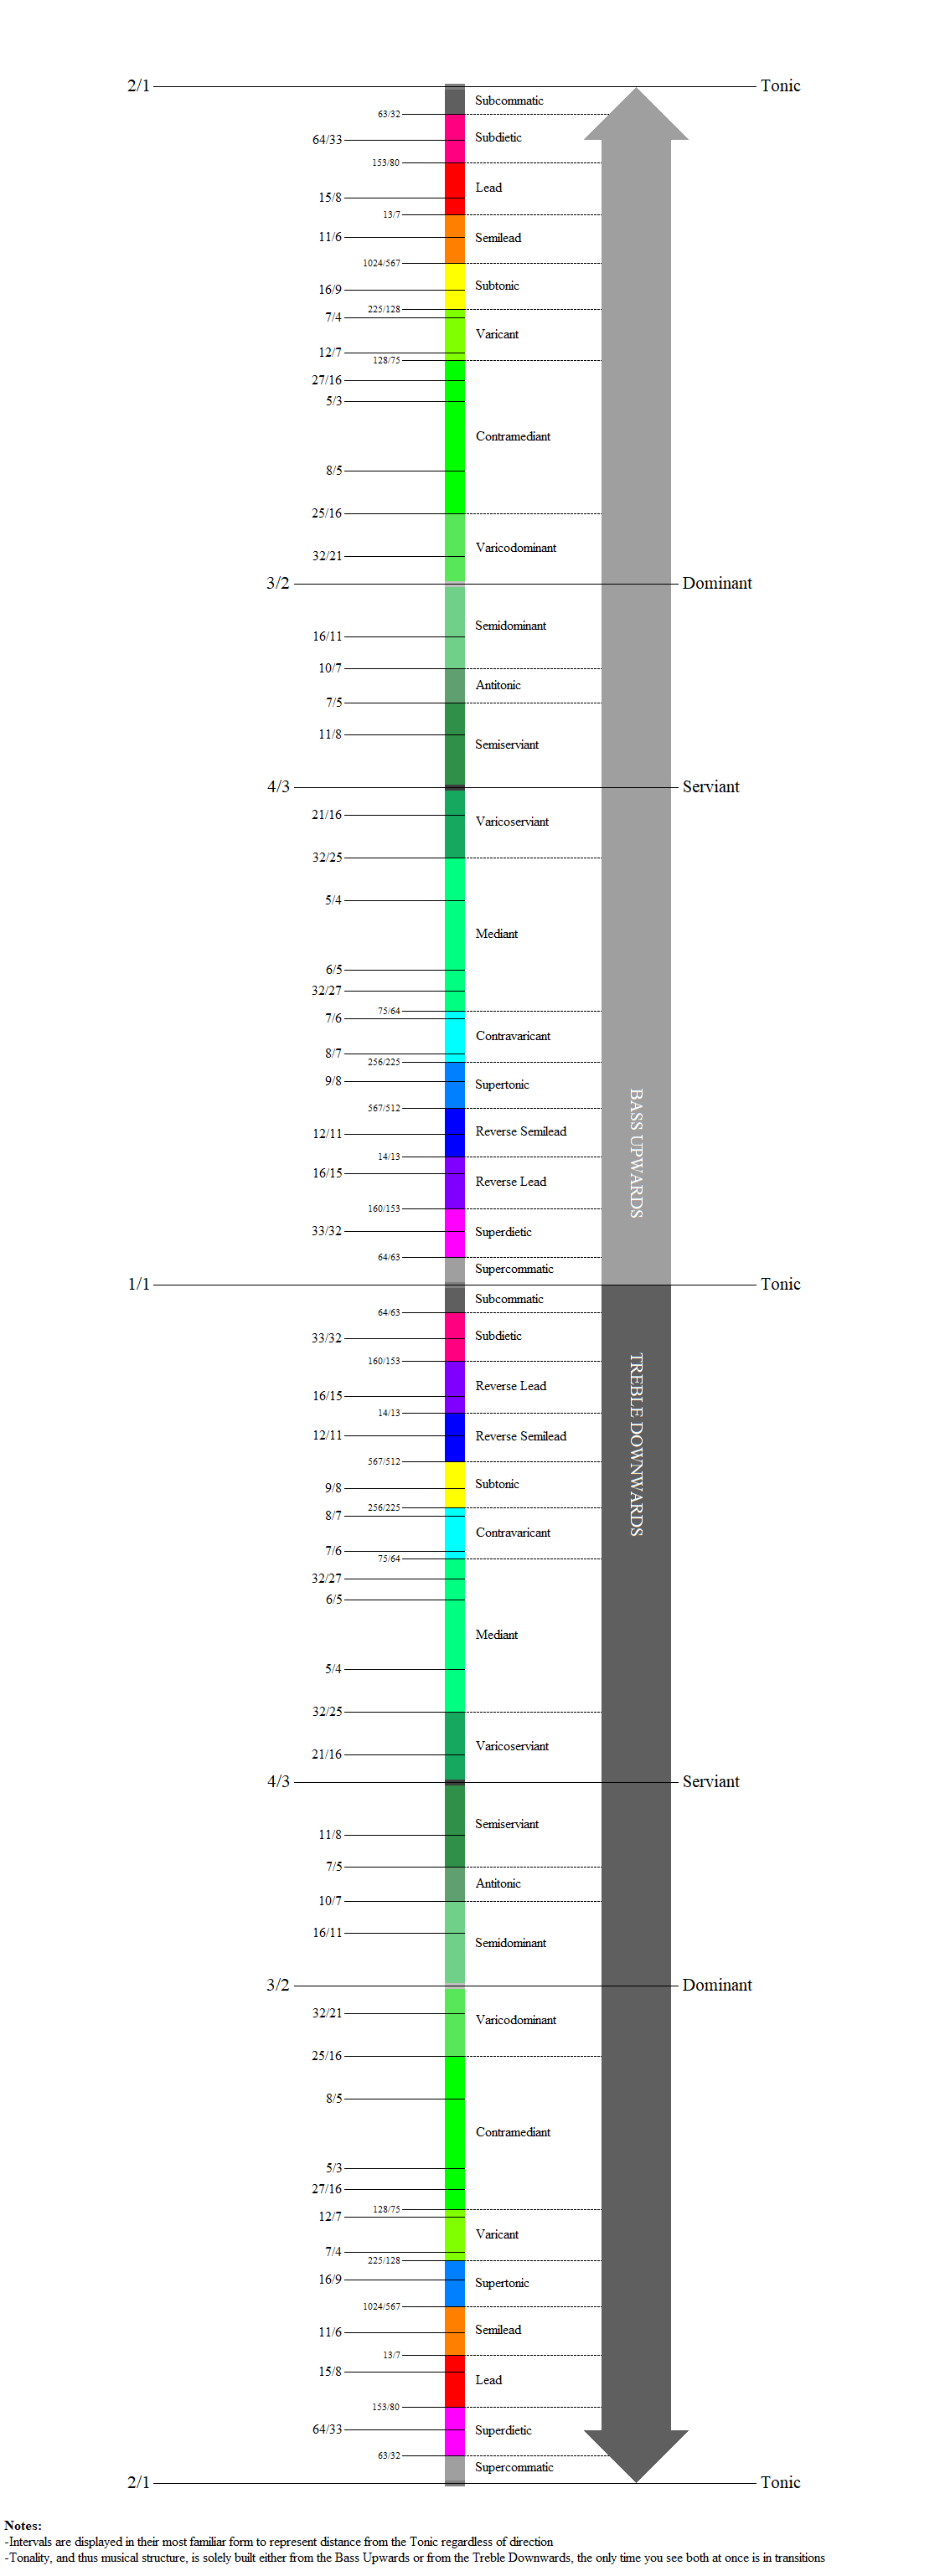
A crudely drawn preliminary map of the locations of regions with different diatonic and paradiatonic functions- the layout changes depending on which direction you build your tonality
File history
Click on a date/time to view the file as it appeared at that time.
| Date/Time | Thumbnail | Dimensions | User | Comment | |
|---|---|---|---|---|---|
| current | 01:09, 19 September 2020 | 379 × 1,024 (15 KB) | Aura (talk | contribs) | Reverted to version as of 17:59, 17 September 2020 (UTC) | |
| 01:04, 19 September 2020 | 1,128 × 3,076 (107 KB) | Aura (talk | contribs) | Larger in size, with examples of familiar ratios added for illustration and hopefully better organization for the chart as a whole | ||
| 17:59, 17 September 2020 | 379 × 1,024 (15 KB) | Aura (talk | contribs) | A crudely drawn preliminary map of the locations of regions with different diatonic and paradiatonic functions- the layout changes depending on which direction you build your tonality |
You cannot overwrite this file.
File usage
The following 2 pages use this file: